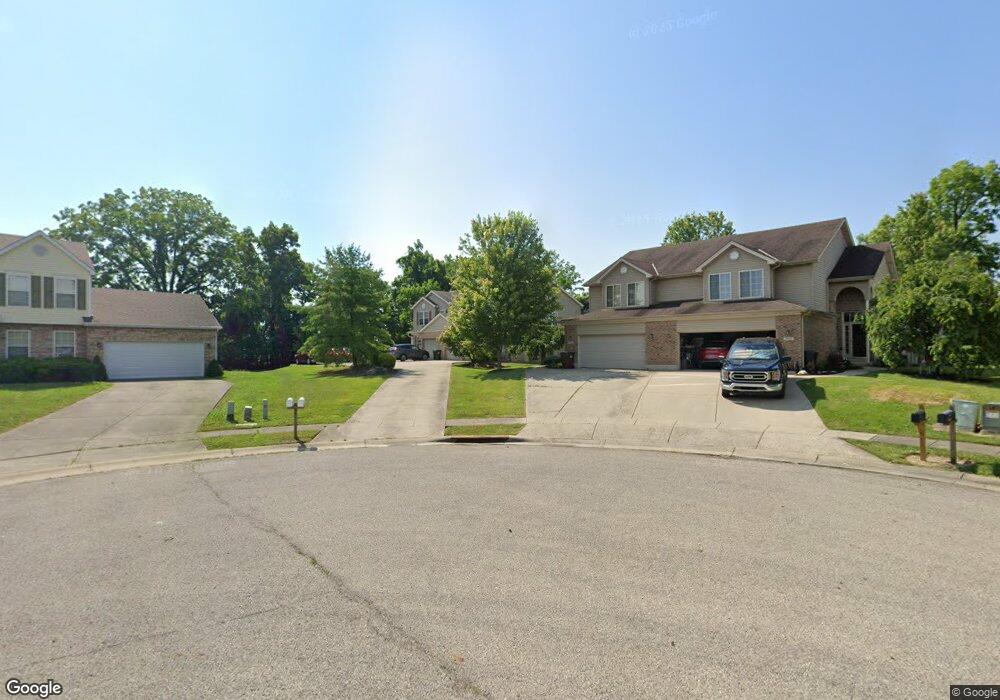
7941 Tara Dr West Chester, OH 45069
West Chester Township NeighborhoodEstimated Value: $373,000 - $464,000
6
Beds
6
Baths
3,030
Sq Ft
$140/Sq Ft
Est. Value
About This Home
This home is located at 7941 Tara Dr, West Chester, OH 45069 and is currently estimated at $424,274, approximately $140 per square foot. 7941 Tara Dr is a home located in Butler County with nearby schools including Adena Elementary School, Lakota Ridge Junior School, and Lakota West High School.
Ownership History
Date
Name
Owned For
Owner Type
Purchase Details
Closed on
Mar 3, 2020
Sold by
Pebble Properties Llc
Bought by
Corns Douglas R and Qualkenbush Corns Tina
Current Estimated Value
Home Financials for this Owner
Home Financials are based on the most recent Mortgage that was taken out on this home.
Original Mortgage
$221,600
Outstanding Balance
$153,813
Interest Rate
3.6%
Mortgage Type
Commercial
Estimated Equity
$270,461
Purchase Details
Closed on
Oct 26, 2005
Sold by
Sunderman August Martin
Bought by
Pebble Properties Llc
Home Financials for this Owner
Home Financials are based on the most recent Mortgage that was taken out on this home.
Original Mortgage
$285,000
Interest Rate
5.8%
Mortgage Type
Seller Take Back
Purchase Details
Closed on
Nov 1, 2002
Sold by
Sunderman August Martin and Sunderman Thelma Lois
Bought by
Sunderman August Martin and August Martin Sunderman Revocable Trust
Purchase Details
Closed on
Feb 1, 2002
Sold by
The Todd Group Inc
Bought by
Sunderman August M and Sunderman Thelma Lois
Create a Home Valuation Report for This Property
The Home Valuation Report is an in-depth analysis detailing your home's value as well as a comparison with similar homes in the area
Home Values in the Area
Average Home Value in this Area
Purchase History
| Date | Buyer | Sale Price | Title Company |
|---|---|---|---|
| Corns Douglas R | $277,000 | None Available | |
| Pebble Properties Llc | $285,000 | -- | |
| Sunderman August Martin | -- | -- | |
| Sunderman August M | $267,150 | -- |
Source: Public Records
Mortgage History
| Date | Status | Borrower | Loan Amount |
|---|---|---|---|
| Open | Corns Douglas R | $221,600 | |
| Previous Owner | Pebble Properties Llc | $285,000 |
Source: Public Records
Tax History Compared to Growth
Tax History
| Year | Tax Paid | Tax Assessment Tax Assessment Total Assessment is a certain percentage of the fair market value that is determined by local assessors to be the total taxable value of land and additions on the property. | Land | Improvement |
|---|---|---|---|---|
| 2024 | $5,339 | $126,280 | $8,920 | $117,360 |
| 2023 | $5,301 | $126,280 | $8,920 | $117,360 |
| 2022 | $4,380 | $79,570 | $8,920 | $70,650 |
| 2021 | $4,119 | $76,210 | $8,920 | $67,290 |
| 2020 | $4,217 | $76,210 | $8,920 | $67,290 |
| 2019 | $7,106 | $74,150 | $8,910 | $65,240 |
| 2018 | $4,309 | $74,150 | $8,910 | $65,240 |
| 2017 | $4,386 | $74,150 | $8,910 | $65,240 |
| 2016 | $4,065 | $64,710 | $8,910 | $55,800 |
| 2015 | $4,059 | $64,710 | $8,910 | $55,800 |
| 2014 | $5,069 | $64,710 | $8,910 | $55,800 |
| 2013 | $5,069 | $78,580 | $13,360 | $65,220 |
Source: Public Records
Map
Nearby Homes
- 7761 Jonathan Ct
- 9302 W Meadow Dr
- 7853 W Chester Rd
- 7950 Ruth Ct
- 9052 Saxton Dr
- 8698 Cox Rd
- 8997 Saxton Dr
- 8749 Monticello Dr
- 8642 Bluebird Ct
- 7971 Jasmine Trail
- 8558 Cox Rd
- 9337 Cincinnati Columbus Rd
- 8141 Stone Dr
- 6930 Walnut Meadows Dr
- 8178 Stone Dr
- 8500 Crestmont Dr
- 7476 W Chester Rd
- 7661 Brookdale Dr
- 8430 Meadowlark Ct
- 8224 Summer View Dr
- 7931 Tara Dr
- 7951 Tara Dr
- 7921 Tara Dr
- 9017 Cincinnati Columbus Rd
- 7961 Tara Dr
- 8985 Cincinnati Columbus Rd
- 7971 Tara Dr
- 7930 Tara Dr
- 7911 Tara Dr
- 7970 Tara Dr
- 7981 Tara Dr
- 7980 Tara Dr
- 8958 Meadowview Dr
- 7991 Tara Dr
- 7899 Tara Dr
- 8942 Meadowview Dr
- 7990 Tara Dr
- 9018 Cincinnati Columbus Rd
- 8001 Tara Dr
- 7887 Tara Dr