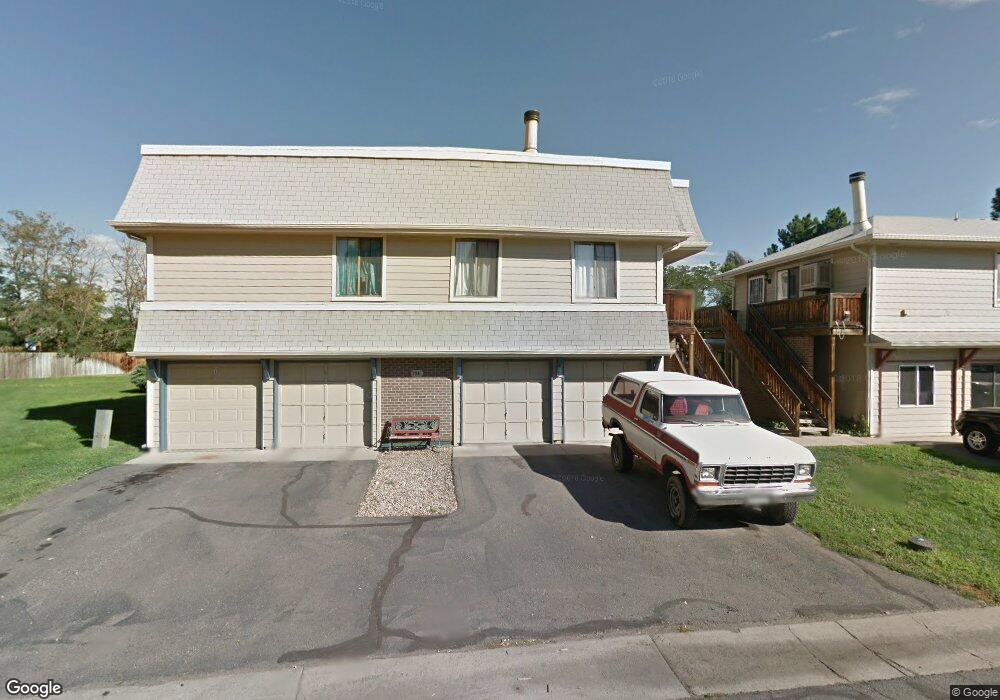
7941 York St Unit 3 Denver, CO 80229
Welby NeighborhoodEstimated Value: $304,000 - $321,980
3
Beds
2
Baths
1,440
Sq Ft
$218/Sq Ft
Est. Value
About This Home
This home is located at 7941 York St Unit 3, Denver, CO 80229 and is currently estimated at $313,495, approximately $217 per square foot. 7941 York St Unit 3 is a home located in Adams County with nearby schools including Trailside Academy and Assumption Catholic School.
Ownership History
Date
Name
Owned For
Owner Type
Purchase Details
Closed on
May 6, 2019
Sold by
Grzemkowski Stacy M
Bought by
Benitez Miguel E and Perez Julia Curz Perez
Current Estimated Value
Home Financials for this Owner
Home Financials are based on the most recent Mortgage that was taken out on this home.
Original Mortgage
$231,725
Outstanding Balance
$204,949
Interest Rate
4.5%
Mortgage Type
FHA
Estimated Equity
$108,546
Purchase Details
Closed on
May 27, 2004
Sold by
Clark Karen L
Bought by
Grzemkowski Stacy M
Home Financials for this Owner
Home Financials are based on the most recent Mortgage that was taken out on this home.
Original Mortgage
$140,422
Interest Rate
4.75%
Mortgage Type
VA
Purchase Details
Closed on
Feb 17, 1998
Sold by
Becker Rodney S and Becker Cindy L
Bought by
Clark Karen L
Home Financials for this Owner
Home Financials are based on the most recent Mortgage that was taken out on this home.
Original Mortgage
$80,707
Interest Rate
6.92%
Mortgage Type
FHA
Create a Home Valuation Report for This Property
The Home Valuation Report is an in-depth analysis detailing your home's value as well as a comparison with similar homes in the area
Home Values in the Area
Average Home Value in this Area
Purchase History
| Date | Buyer | Sale Price | Title Company |
|---|---|---|---|
| Benitez Miguel E | $236,000 | First American Title | |
| Grzemkowski Stacy M | $137,400 | American Liberty Title | |
| Clark Karen L | $81,000 | Land Title |
Source: Public Records
Mortgage History
| Date | Status | Borrower | Loan Amount |
|---|---|---|---|
| Open | Benitez Miguel E | $231,725 | |
| Previous Owner | Grzemkowski Stacy M | $140,422 | |
| Previous Owner | Clark Karen L | $80,707 |
Source: Public Records
Tax History Compared to Growth
Tax History
| Year | Tax Paid | Tax Assessment Tax Assessment Total Assessment is a certain percentage of the fair market value that is determined by local assessors to be the total taxable value of land and additions on the property. | Land | Improvement |
|---|---|---|---|---|
| 2024 | $1,838 | $20,060 | $3,810 | $16,250 |
| 2023 | $1,826 | $21,790 | $3,520 | $18,270 |
| 2022 | $1,747 | $16,210 | $3,610 | $12,600 |
| 2021 | $1,646 | $16,210 | $3,610 | $12,600 |
| 2020 | $1,593 | $15,880 | $3,720 | $12,160 |
| 2019 | $1,600 | $15,880 | $3,720 | $12,160 |
| 2018 | $1,409 | $13,200 | $790 | $12,410 |
| 2017 | $1,383 | $13,200 | $790 | $12,410 |
| 2016 | $907 | $8,480 | $880 | $7,600 |
| 2015 | $802 | $8,480 | $880 | $7,600 |
| 2014 | $688 | $7,060 | $880 | $6,180 |
Source: Public Records
Map
Nearby Homes
- 7945 York St Unit 3
- 2105 Coronado Pkwy N Unit C
- 7891 York St Unit 3
- 7863 York St
- 2246 Coronado Pkwy N Unit A
- 2123 Coronado Pkwy N Unit C
- 2143 Coronado Pkwy N Unit 17D
- 2143 Coronado Pkwy N Unit C
- 2141 Coronado Pkwy N Unit B
- 1616 E 78th Ave Unit 143
- 7906 Lafayette Way
- 1522 Quivira Dr
- 7868 Downing St
- 1647 E 83rd Ave
- 8199 Welby Rd Unit 2105
- 8199 Welby Rd Unit 1007
- 8199 Welby Rd Unit 3102
- 2221 E 84th Ave
- 8156 Downing St
- 1820 Mable Ave
- 7941 York St Unit 4
- 7941 York St Unit 2
- 7941 York St Unit 1
- 7943 York St Unit 2
- 7943 York St Unit 1
- 7943 York St Unit 3
- 7939 York St Unit 2
- 7939 York St Unit 1
- 7939 York St Unit 3
- 7945 York St Unit 1
- 7947 York St Unit 2
- 7947 York St Unit 1
- 7947 York St Unit 3
- 7937 York St Unit 2
- 7937 York St Unit 3
- 7937 York St Unit 1
- 7953 York St Unit 2
- 7953 York St Unit 1
- 7935 York St Unit 2
- 7935 York St Unit 1