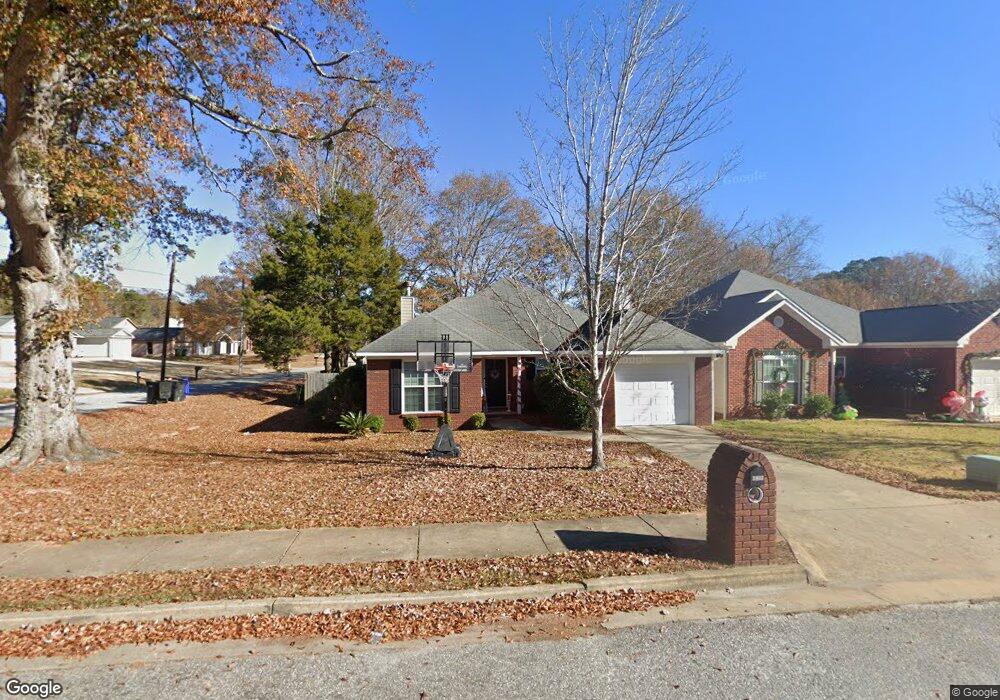
7942 Brooks Crossing Dr Columbus, GA 31909
Northern Columbus NeighborhoodEstimated Value: $214,851 - $233,000
3
Beds
3
Baths
1,430
Sq Ft
$156/Sq Ft
Est. Value
About This Home
This home is located at 7942 Brooks Crossing Dr, Columbus, GA 31909 and is currently estimated at $223,213, approximately $156 per square foot. 7942 Brooks Crossing Dr is a home located in Muscogee County with nearby schools including North Columbus Elementary School, Veterans Memorial Middle School, and Northside High School.
Ownership History
Date
Name
Owned For
Owner Type
Purchase Details
Closed on
Oct 12, 2011
Sold by
Goodrich Amy Mccraney
Bought by
Mccraney Amy Dawn
Current Estimated Value
Home Financials for this Owner
Home Financials are based on the most recent Mortgage that was taken out on this home.
Original Mortgage
$145,743
Outstanding Balance
$101,299
Interest Rate
4.5%
Mortgage Type
FHA
Estimated Equity
$121,914
Purchase Details
Closed on
Sep 14, 2010
Sold by
Goodrich Johnathon R
Bought by
Goodrich Amy M
Purchase Details
Closed on
Mar 30, 2007
Sold by
Cce Venture Llc
Bought by
Goodrich Johnathon R and Goodrich Amy Mccraney
Home Financials for this Owner
Home Financials are based on the most recent Mortgage that was taken out on this home.
Original Mortgage
$24,300
Interest Rate
6.11%
Mortgage Type
Unknown
Create a Home Valuation Report for This Property
The Home Valuation Report is an in-depth analysis detailing your home's value as well as a comparison with similar homes in the area
Home Values in the Area
Average Home Value in this Area
Purchase History
| Date | Buyer | Sale Price | Title Company |
|---|---|---|---|
| Mccraney Amy Dawn | -- | -- | |
| Goodrich Amy M | -- | None Available | |
| Goodrich Johnathon R | $162,000 | None Available |
Source: Public Records
Mortgage History
| Date | Status | Borrower | Loan Amount |
|---|---|---|---|
| Open | Mccraney Amy Dawn | $145,743 | |
| Previous Owner | Goodrich Johnathon R | $24,300 | |
| Previous Owner | Goodrich Johnathon R | $129,600 |
Source: Public Records
Tax History Compared to Growth
Tax History
| Year | Tax Paid | Tax Assessment Tax Assessment Total Assessment is a certain percentage of the fair market value that is determined by local assessors to be the total taxable value of land and additions on the property. | Land | Improvement |
|---|---|---|---|---|
| 2025 | $2,645 | $67,576 | $10,132 | $57,444 |
| 2024 | $2,645 | $67,576 | $10,132 | $57,444 |
| 2023 | $2,662 | $67,576 | $10,132 | $57,444 |
| 2022 | $2,313 | $56,640 | $10,132 | $46,508 |
| 2021 | $2,228 | $54,564 | $10,132 | $44,432 |
| 2020 | $2,228 | $54,564 | $10,132 | $44,432 |
| 2019 | $2,236 | $54,564 | $10,132 | $44,432 |
| 2018 | $2,236 | $54,564 | $10,132 | $44,432 |
| 2017 | $2,243 | $54,564 | $10,132 | $44,432 |
| 2016 | $2,626 | $63,657 | $14,000 | $49,657 |
| 2015 | $2,629 | $63,657 | $14,000 | $49,657 |
| 2014 | $2,632 | $63,657 | $14,000 | $49,657 |
| 2013 | -- | $63,657 | $14,000 | $49,657 |
Source: Public Records
Map
Nearby Homes
- 1727 Fountain Ct
- 7559 Crescent Dr
- 7407 Peppercorn Dr
- 1719 Double Churches Rd
- 1535 Doubletree Dr
- 7995 Big Creek Place
- 1579 Magnolia Way
- 1438 Grove Park Dr Unit 13B
- 7313 Sesame St
- 8300 Fortson Rd
- 8350 Fortson Rd
- 8008 Lagoon Ct
- 8217 Remey Dr
- 7170 Bridgemill Dr
- 18 Peppertree Ct
- 7700 Veterans Pkwy
- 7185 Helen Dr
- 8344 Twin Chapel Dr
- 1512 Tom Buk Tu Ln
- 1058 Cedarbrook Dr
- 7944 Brooks Crossing Dr Unit D
- 7944 Brooks Crossing Dr
- 7946 Brooks Crossing Dr
- 7960 Shinn Dr
- 7948 Brooks Crossing Dr
- 7964 Shinn Dr
- 7941 Brooks Crossing Dr
- 7945 Brooks Crossing Dr
- 7947 Brooks Crossing Dr
- 7950 Brooks Crossing Dr
- 7953 Shinn Dr
- 7968 Shinn Dr
- 7949 Shinn Dr
- 7949 Brooks Crossing Dr
- 7957 Shinn Dr
- 7935 Shinn Dr
- 7961 Shinn Dr
- 7951 Brooks Crossing Dr
- 7941 Shinn Dr
- 7952 Brooks Crossing Dr