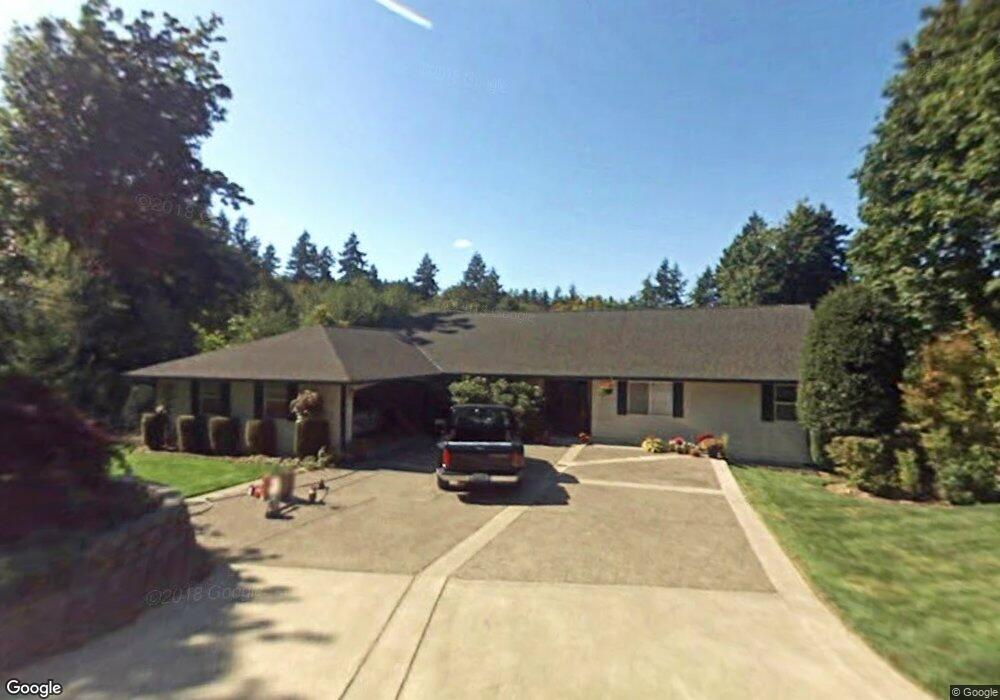
7943 University Point Cir NE Bremerton, WA 98311
Estimated Value: $605,000 - $649,000
3
Beds
3
Baths
2,205
Sq Ft
$284/Sq Ft
Est. Value
About This Home
This home is located at 7943 University Point Cir NE, Bremerton, WA 98311 and is currently estimated at $627,047, approximately $284 per square foot. 7943 University Point Cir NE is a home located in Kitsap County with nearby schools including Brownsville Elementary School, Ridgetop Middle School, and Olympic High School.
Ownership History
Date
Name
Owned For
Owner Type
Purchase Details
Closed on
Jun 18, 2025
Sold by
Tate Katherine M and Mcandrews Katherine Mary
Bought by
Katherine M Mcandrews And James F Mcandrews J and Mcandrews
Current Estimated Value
Purchase Details
Closed on
Oct 17, 2001
Sold by
Connolly Wilma M
Bought by
Tate Katherine M and Mcandrews James F
Home Financials for this Owner
Home Financials are based on the most recent Mortgage that was taken out on this home.
Original Mortgage
$88,000
Interest Rate
6.87%
Purchase Details
Closed on
Aug 16, 2001
Sold by
Hawkins Marilyn L
Bought by
Bowser Martha
Purchase Details
Closed on
Aug 14, 1995
Sold by
Cunningham Melvin D and Cunningham Linda M
Bought by
Connolly Wilma M
Home Financials for this Owner
Home Financials are based on the most recent Mortgage that was taken out on this home.
Original Mortgage
$87,000
Interest Rate
7.71%
Create a Home Valuation Report for This Property
The Home Valuation Report is an in-depth analysis detailing your home's value as well as a comparison with similar homes in the area
Home Values in the Area
Average Home Value in this Area
Purchase History
| Date | Buyer | Sale Price | Title Company |
|---|---|---|---|
| Katherine M Mcandrews And James F Mcandrews J | $313 | None Listed On Document | |
| Tate Katherine M | $215,000 | Transnation Title Insurance | |
| Bowser Martha | -- | -- | |
| Connolly Wilma M | $177,000 | Charter Title Corporation |
Source: Public Records
Mortgage History
| Date | Status | Borrower | Loan Amount |
|---|---|---|---|
| Previous Owner | Tate Katherine M | $88,000 | |
| Previous Owner | Connolly Wilma M | $87,000 |
Source: Public Records
Tax History Compared to Growth
Tax History
| Year | Tax Paid | Tax Assessment Tax Assessment Total Assessment is a certain percentage of the fair market value that is determined by local assessors to be the total taxable value of land and additions on the property. | Land | Improvement |
|---|---|---|---|---|
| 2026 | $5,243 | $557,640 | $127,230 | $430,410 |
| 2025 | $5,243 | $557,640 | $127,230 | $430,410 |
| 2024 | $5,100 | $557,640 | $127,230 | $430,410 |
| 2023 | $5,118 | $557,640 | $127,230 | $430,410 |
| 2022 | $4,819 | $462,300 | $105,150 | $357,150 |
| 2021 | $5,089 | $465,300 | $88,320 | $376,980 |
| 2020 | $4,753 | $439,620 | $83,350 | $356,270 |
| 2019 | $4,430 | $396,320 | $75,260 | $321,060 |
| 2018 | $4,751 | $329,400 | $62,200 | $267,200 |
| 2017 | $4,220 | $329,400 | $62,200 | $267,200 |
| 2016 | $4,100 | $295,820 | $55,540 | $240,280 |
| 2015 | $3,709 | $278,880 | $61,520 | $217,360 |
| 2014 | -- | $265,880 | $61,520 | $204,360 |
| 2013 | -- | $265,880 | $61,520 | $204,360 |
Source: Public Records
Map
Nearby Homes
- 8087 Lars Dr NE
- 7550 Varsity Ln NE
- 0 University Point Cir NE
- 8491 Illahee Rd NE
- 3915 NE Hyak Way
- 3000 NE Loyola St
- 3709 NE Liverpool Dr
- 3496 NE Quinault Dr
- 3703 NE Trout Brook Ln
- 3 Illahee Rd NE
- 3744 NE Trout Brook Ln
- 3840 NE Ambleside Ln
- 2940 Osiris Ct NE
- 7265 Thasos Ave NE
- 7726 Lazy s Ln NE
- 8018 Hansen Rd NE
- 3060 NE Mcwilliams Rd Unit 124
- 3060 NE Mcwilliams Rd Unit 9
- 3060 NE Mcwilliams Rd Unit 2
- 0 Woodbank Dr NE
- 7945 University Point Cir NE
- 8017 University Point Cir NE
- 8077 University Point Cir NE
- 7989 University Point Cir NE
- 7995 University Point Cir NE
- 8010 Sabbatical Loop NE
- 7983 University Point Cir NE
- 8010 Sabbatical Loop NE
- 7947 University Point Cir NE
- 7950 University Point Cir NE
- 8016 Sabbatical Loop NE
- 8001 University Point Cir NE
- 7980 University Point Cir NE
- 7911 University Point Cir NE
- 8105 University Point Cir NE
- 7975 University Point Cir NE
- 8125 University Point Cir NE
- 7930 University Point Cir NE
- 8142 Safe Harbor Ln NE