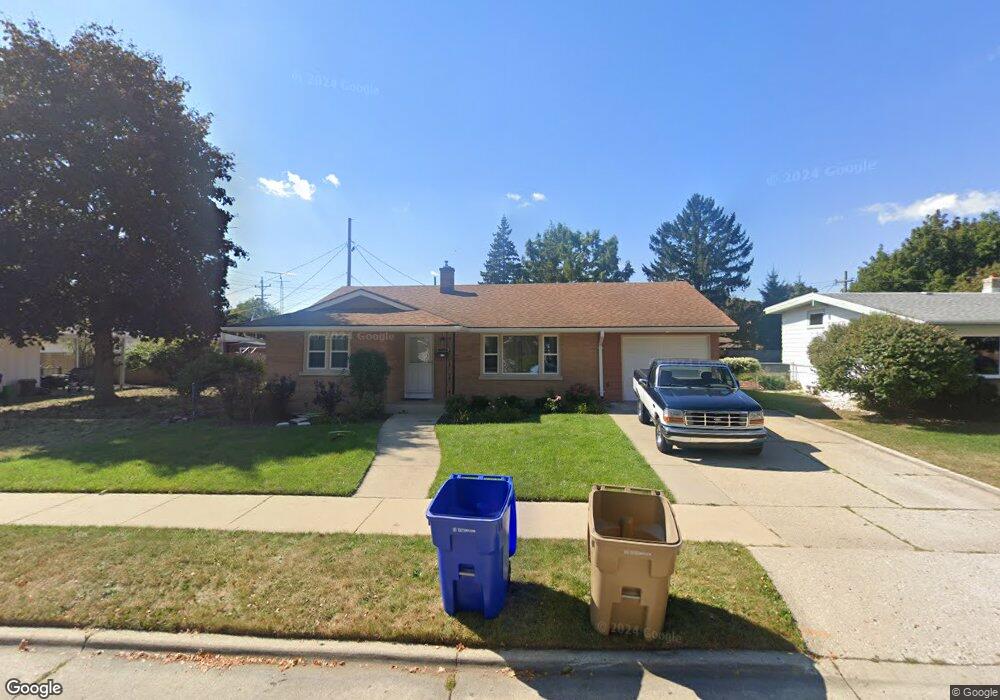
7944 17th Ave Kenosha, WI 53143
Sunnyside NeighborhoodEstimated Value: $222,000 - $254,000
2
Beds
1
Bath
1,185
Sq Ft
$202/Sq Ft
Est. Value
About This Home
This home is located at 7944 17th Ave, Kenosha, WI 53143 and is currently estimated at $239,951, approximately $202 per square foot. 7944 17th Ave is a home located in Kenosha County with nearby schools including Grewenow Elementary School, Lincoln Middle School, and Tremper High School.
Ownership History
Date
Name
Owned For
Owner Type
Purchase Details
Closed on
Mar 28, 2022
Sold by
J. Richards Kent and G. Beverly
Bought by
S. Emery Louis
Current Estimated Value
Purchase Details
Closed on
Aug 22, 2011
Sold by
Tredup Jeffrey A and Tredup Rose Ann
Bought by
Richards Kent J and Richards Beverly G
Purchase Details
Closed on
Sep 9, 2010
Sold by
Vanbeckum Jeffrey A
Bought by
Tredup Jeffrey
Purchase Details
Closed on
Jul 14, 2010
Sold by
Vanbeckum Irrevoc Dorothy
Bought by
Vanbeckum Jeffrey A
Create a Home Valuation Report for This Property
The Home Valuation Report is an in-depth analysis detailing your home's value as well as a comparison with similar homes in the area
Home Values in the Area
Average Home Value in this Area
Purchase History
| Date | Buyer | Sale Price | Title Company |
|---|---|---|---|
| S. Emery Louis | $175,000 | Fidelity Title Inc | |
| Richards Kent J | $105,000 | -- | |
| Tredup Jeffrey | $47,000 | -- | |
| Tredup Jeffrey | $23,500 | -- | |
| Vanbeckum Jeffrey A | $25,000 | -- |
Source: Public Records
Tax History Compared to Growth
Tax History
| Year | Tax Paid | Tax Assessment Tax Assessment Total Assessment is a certain percentage of the fair market value that is determined by local assessors to be the total taxable value of land and additions on the property. | Land | Improvement |
|---|---|---|---|---|
| 2024 | $2,976 | $129,300 | $35,600 | $93,700 |
| 2023 | $2,976 | $129,300 | $35,600 | $93,700 |
| 2022 | $3,020 | $129,300 | $35,600 | $93,700 |
| 2021 | $3,095 | $129,300 | $35,600 | $93,700 |
| 2020 | $3,208 | $129,300 | $35,600 | $93,700 |
| 2019 | $3,081 | $129,300 | $35,600 | $93,700 |
| 2018 | $3,031 | $111,500 | $35,600 | $75,900 |
| 2017 | $2,886 | $111,500 | $35,600 | $75,900 |
| 2016 | $2,947 | $111,500 | $35,600 | $75,900 |
| 2015 | $2,882 | $105,200 | $35,600 | $69,600 |
| 2014 | $2,868 | $105,200 | $35,600 | $69,600 |
Source: Public Records
Map
Nearby Homes