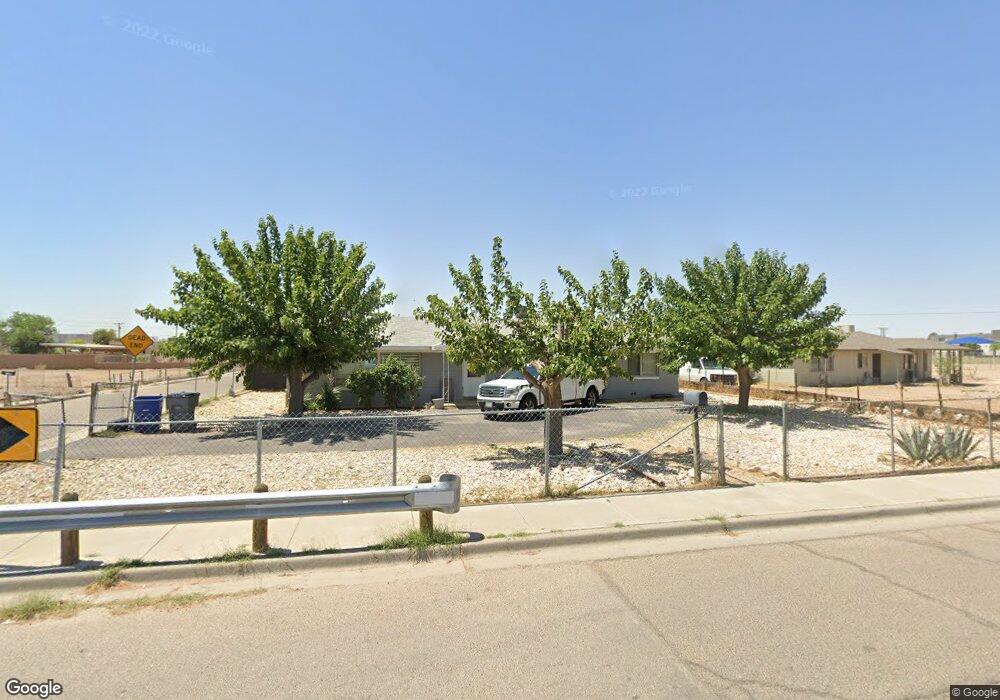
7944 La Jolla Dr El Paso, TX 79915
Santa Lucia NeighborhoodEstimated Value: $189,000 - $242,617
3
Beds
2
Baths
1,952
Sq Ft
$109/Sq Ft
Est. Value
About This Home
This home is located at 7944 La Jolla Dr, El Paso, TX 79915 and is currently estimated at $213,654, approximately $109 per square foot. 7944 La Jolla Dr is a home located in El Paso County with nearby schools including North Loop Elementary School, Bel Air Middle, and Bel Air High School.
Ownership History
Date
Name
Owned For
Owner Type
Purchase Details
Closed on
Dec 1, 2020
Sold by
Galvan Fierro Enedina and Carrillo Enedina
Bought by
Carrillo Antonio
Current Estimated Value
Home Financials for this Owner
Home Financials are based on the most recent Mortgage that was taken out on this home.
Original Mortgage
$173,910
Outstanding Balance
$155,108
Interest Rate
2.8%
Mortgage Type
VA
Estimated Equity
$58,546
Purchase Details
Closed on
Nov 11, 2020
Sold by
Portillo Alejandro Galvan
Bought by
Fierro Enedina Galvan
Home Financials for this Owner
Home Financials are based on the most recent Mortgage that was taken out on this home.
Original Mortgage
$173,910
Outstanding Balance
$155,108
Interest Rate
2.8%
Mortgage Type
VA
Estimated Equity
$58,546
Purchase Details
Closed on
Sep 11, 2020
Sold by
Galvan Portillo Alejandro
Bought by
Galvan Fierro Enedina
Purchase Details
Closed on
May 31, 1997
Sold by
Carrillo Antonio
Bought by
Carrillo Enedina
Create a Home Valuation Report for This Property
The Home Valuation Report is an in-depth analysis detailing your home's value as well as a comparison with similar homes in the area
Home Values in the Area
Average Home Value in this Area
Purchase History
| Date | Buyer | Sale Price | Title Company |
|---|---|---|---|
| Carrillo Antonio | -- | None Listed On Document | |
| Fierro Enedina Galvan | -- | None Available | |
| Galvan Fierro Enedina | -- | None Listed On Document | |
| Carrillo Enedina | -- | -- |
Source: Public Records
Mortgage History
| Date | Status | Borrower | Loan Amount |
|---|---|---|---|
| Open | Carrillo Antonio | $173,910 |
Source: Public Records
Tax History Compared to Growth
Tax History
| Year | Tax Paid | Tax Assessment Tax Assessment Total Assessment is a certain percentage of the fair market value that is determined by local assessors to be the total taxable value of land and additions on the property. | Land | Improvement |
|---|---|---|---|---|
| 2025 | $5,850 | $237,459 | $39,016 | $198,443 |
| 2024 | $5,850 | $212,983 | $14,540 | $198,443 |
| 2023 | $5,850 | $198,152 | $14,540 | $183,612 |
| 2022 | $5,632 | $181,360 | $14,540 | $166,820 |
| 2021 | $4,730 | $145,520 | $14,540 | $130,980 |
| 2020 | $4,087 | $129,411 | $14,540 | $114,871 |
| 2019 | $4,061 | $129,411 | $14,540 | $114,871 |
| 2018 | $3,996 | $128,512 | $14,540 | $113,972 |
| 2017 | $3,678 | $120,309 | $14,540 | $105,769 |
| 2016 | $3,678 | $120,309 | $14,540 | $105,769 |
| 2015 | $2,863 | $120,309 | $14,540 | $105,769 |
| 2014 | $2,863 | $120,657 | $14,540 | $106,117 |
Source: Public Records
Map
Nearby Homes
- 7921 Lirio Rd
- 7909 La Jolla Dr
- 537 Emerson St
- 525 Lafayette Dr
- 405 Lafayette Dr
- 7937 San Paulo Dr
- 7800 Hermosillo Dr
- 7928 Hermosillo Dr
- 7798 Rosedale St
- 7655 Hacienda Ave
- 7907 Alameda Ave
- 423 N Carolina Dr
- 812 Santa Barbara Dr
- 3 Atkinson Way
- 8138 Saint Andrew Ln Unit ABCD
- 844 Santa Barbara Dr
- 443 Cadwallader Dr
- 7556 N Loop Dr
- 7542 Hermosillo Dr
- 8004 Gilbert Dr
- 7936 La Jolla Dr
- 473 Myra St
- 469 Myra St
- 7945 La Jolla Dr Unit A
- 7945 La Jolla Dr Unit B
- 7949 La Jolla Dr
- 7941 La Jolla Dr Unit B
- 7941 La Jolla Dr Unit A
- 465 Myra St
- 7951 La Jolla Dr
- 7939 La Jolla Dr Unit A
- 7939 La Jolla Dr Unit B
- 7956 La Jolla Dr
- 7937 La Jolla Dr
- 508 Myra St
- 461 Myra St
- 7941 Lirio Rd
- 7941 Lirio Rd
- 513 Myra St
- 461 Gallagher St