7945 Saint Marlo Fairway Dr Duluth, GA 30097
Estimated Value: $1,225,734 - $1,702,000
4
Beds
6
Baths
3,974
Sq Ft
$380/Sq Ft
Est. Value
About This Home
This home is located at 7945 Saint Marlo Fairway Dr, Duluth, GA 30097 and is currently estimated at $1,509,434, approximately $379 per square foot. 7945 Saint Marlo Fairway Dr is a home located in Forsyth County with nearby schools including Johns Creek Elementary School, Riverwatch Middle School, and Lambert High School.
Ownership History
Date
Name
Owned For
Owner Type
Purchase Details
Closed on
Jul 16, 2024
Sold by
Paik Moon S and Colon Mel J
Bought by
Paik Moon S and Paik Colon Moon
Current Estimated Value
Purchase Details
Closed on
Feb 27, 2011
Sold by
Hale Kristi
Bought by
Paik Moon S and Choi Jihee
Purchase Details
Closed on
Feb 21, 2011
Sold by
Paik Moon S
Bought by
Hale Kristi
Purchase Details
Closed on
May 12, 2004
Sold by
Poe Amy B
Bought by
Paik Moon S
Home Financials for this Owner
Home Financials are based on the most recent Mortgage that was taken out on this home.
Original Mortgage
$482,300
Interest Rate
6.99%
Mortgage Type
New Conventional
Purchase Details
Closed on
Jun 29, 2000
Sold by
Southern States Construction Llc
Bought by
Poe Steve M
Home Financials for this Owner
Home Financials are based on the most recent Mortgage that was taken out on this home.
Original Mortgage
$285,000
Interest Rate
7.88%
Mortgage Type
New Conventional
Create a Home Valuation Report for This Property
The Home Valuation Report is an in-depth analysis detailing your home's value as well as a comparison with similar homes in the area
Home Values in the Area
Average Home Value in this Area
Purchase History
| Date | Buyer | Sale Price | Title Company |
|---|---|---|---|
| Paik Moon S | -- | None Listed On Document | |
| Paik Moon S | -- | -- | |
| Hale Kristi | -- | -- | |
| Paik Moon S | $689,000 | -- | |
| Poe Steve M | $439,900 | -- |
Source: Public Records
Mortgage History
| Date | Status | Borrower | Loan Amount |
|---|---|---|---|
| Previous Owner | Paik Moon S | $482,300 | |
| Previous Owner | Poe Steve M | $285,000 |
Source: Public Records
Tax History Compared to Growth
Tax History
| Year | Tax Paid | Tax Assessment Tax Assessment Total Assessment is a certain percentage of the fair market value that is determined by local assessors to be the total taxable value of land and additions on the property. | Land | Improvement |
|---|---|---|---|---|
| 2025 | $2,348 | $519,208 | $100,000 | $419,208 |
| 2024 | $2,348 | $527,156 | $80,000 | $447,156 |
| 2023 | $2,244 | $461,060 | $72,000 | $389,060 |
| 2022 | $9,201 | $313,668 | $60,000 | $253,668 |
| 2021 | $8,382 | $313,668 | $60,000 | $253,668 |
| 2020 | $2,208 | $288,408 | $60,000 | $228,408 |
| 2019 | $7,923 | $286,512 | $60,000 | $226,512 |
| 2018 | $7,918 | $286,336 | $60,000 | $226,336 |
| 2017 | $8,002 | $288,332 | $60,000 | $228,332 |
| 2016 | $7,447 | $268,332 | $40,000 | $228,332 |
| 2015 | $7,461 | $268,332 | $40,000 | $228,332 |
| 2014 | $6,575 | $248,356 | $0 | $0 |
Source: Public Records
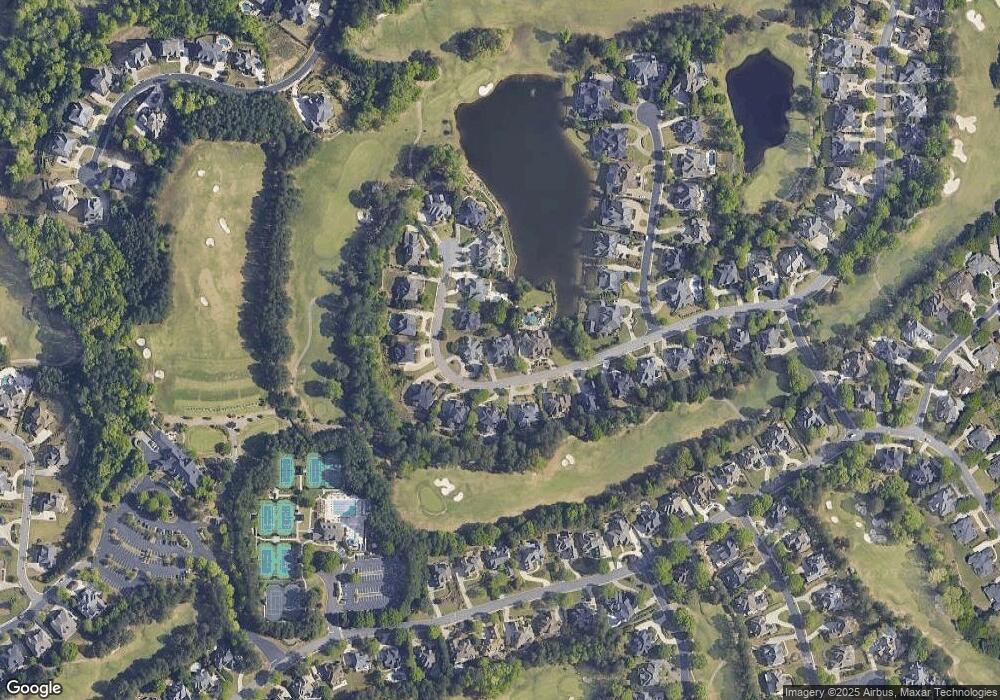
Map
Nearby Homes
- 8060 Derbyshire Ct
- 7745 Saint Marlo Country Club Pkwy
- 8480 St Marlo Fairway Dr
- 8295 St Marlo Fairway Dr
- 8405 Saint Marlo Fairway Dr
- 7910 Tintern Trace
- 8715 Islesworth Ct
- 8760 Colonial Place
- 5925 Read Rd
- 8320 Kenningston Way
- 1370 Boomer Cir
- 5825 Ballantyne Way
- 1020 Grace Ct
- 955 Gardiner Cir
- 5885 Trailwood Ct
- 5865 Trailwood Ct
- 8095 Georgetown Cir
- 7520 Ledgewood Way
- 5715 Upper Creek Ct
- 7925 St Marlo Fairway Dr
- 7925 Saint Marlo Fairway Dr
- 7885 Saint Marlo Fairway Dr
- 0 Saint Marlo Fairway Dr Unit 8691644
- 0 Saint Marlo Fairway Dr Unit 8681362
- 0 Saint Marlo Fairway Dr Unit 8137876
- 0 Saint Marlo Fairway Dr Unit 7604061
- 0 Saint Marlo Fairway Dr Unit 8837223
- 0 Saint Marlo Fairway Dr Unit 3109412
- 0 Saint Marlo Fairway Dr Unit 3129716
- 0 Saint Marlo Fairway Dr Unit 3149206
- 0 Saint Marlo Fairway Dr Unit 3186962
- 0 Saint Marlo Fairway Dr Unit 3210724
- 0 Saint Marlo Fairway Dr Unit 3240542
- 0 Saint Marlo Fairway Dr Unit 3249705
- 0 Saint Marlo Fairway Dr Unit 7045667
- 0 Saint Marlo Fairway Dr Unit 7063188
- 0 Saint Marlo Fairway Dr Unit 7068898
- 0 Saint Marlo Fairway Dr Unit 7081351
- 0 Saint Marlo Fairway Dr Unit 7102902