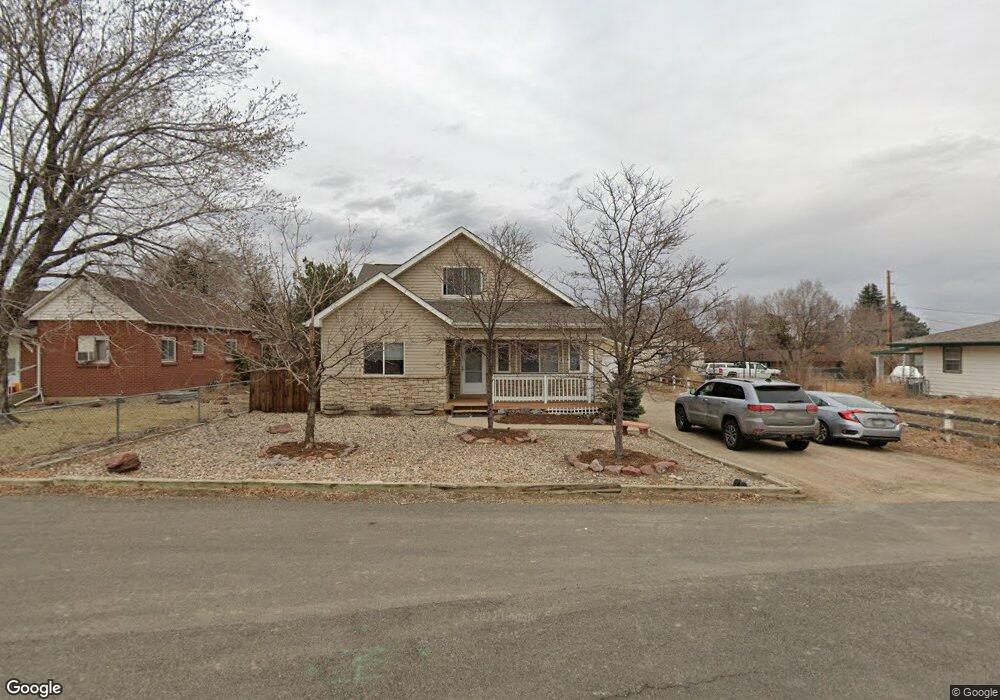
7945 W 119th Ave Broomfield, CO 80020
Estimated Value: $529,000 - $595,000
3
Beds
3
Baths
2,110
Sq Ft
$266/Sq Ft
Est. Value
About This Home
This home is located at 7945 W 119th Ave, Broomfield, CO 80020 and is currently estimated at $560,342, approximately $265 per square foot. 7945 W 119th Ave is a home located in Broomfield County with nearby schools including Semper Elementary School, Mandalay Middle School, and Standley Lake High School.
Ownership History
Date
Name
Owned For
Owner Type
Purchase Details
Closed on
Sep 23, 2021
Sold by
Mccue Kurt
Bought by
Terry Carolyn
Current Estimated Value
Purchase Details
Closed on
Nov 4, 2016
Sold by
Thorngren David C
Bought by
Mccue Kurt
Home Financials for this Owner
Home Financials are based on the most recent Mortgage that was taken out on this home.
Original Mortgage
$343,734
Interest Rate
3.48%
Mortgage Type
VA
Purchase Details
Closed on
Feb 1, 2007
Sold by
Thorngren Jason E and Thorngren Brittany
Bought by
Thorngren David C
Home Financials for this Owner
Home Financials are based on the most recent Mortgage that was taken out on this home.
Original Mortgage
$51,200
Interest Rate
5.88%
Mortgage Type
Stand Alone Second
Purchase Details
Closed on
Jul 14, 2003
Sold by
Bower Steven L
Bought by
Thorngren Jason E
Purchase Details
Closed on
Dec 26, 1978
Sold by
Castens Vernon H and Castens Geraldine L
Bought by
Bower Steven L
Create a Home Valuation Report for This Property
The Home Valuation Report is an in-depth analysis detailing your home's value as well as a comparison with similar homes in the area
Home Values in the Area
Average Home Value in this Area
Purchase History
| Date | Buyer | Sale Price | Title Company |
|---|---|---|---|
| Terry Carolyn | $498,000 | Land Title Guarantee | |
| Mccue Kurt | $336,500 | Canyon Title | |
| Thorngren David C | $256,000 | None Available | |
| Thorngren Jason E | $35,000 | Title America | |
| Bower Steven L | $4,000 | -- |
Source: Public Records
Mortgage History
| Date | Status | Borrower | Loan Amount |
|---|---|---|---|
| Previous Owner | Mccue Kurt | $343,734 | |
| Previous Owner | Thorngren David C | $51,200 | |
| Previous Owner | Thorngren David C | $204,800 |
Source: Public Records
Tax History Compared to Growth
Tax History
| Year | Tax Paid | Tax Assessment Tax Assessment Total Assessment is a certain percentage of the fair market value that is determined by local assessors to be the total taxable value of land and additions on the property. | Land | Improvement |
|---|---|---|---|---|
| 2025 | $3,206 | $40,780 | $6,430 | $34,350 |
| 2024 | $3,206 | $36,010 | $6,200 | $29,810 |
| 2023 | $3,206 | $41,180 | $7,090 | $34,090 |
| 2022 | $2,816 | $31,030 | $4,820 | $26,210 |
| 2021 | $2,883 | $31,910 | $4,950 | $26,960 |
| 2020 | $2,468 | $26,910 | $4,500 | $22,410 |
| 2019 | $2,465 | $27,100 | $4,540 | $22,560 |
| 2018 | $2,231 | $23,770 | $2,990 | $20,780 |
| 2017 | $2,069 | $26,270 | $3,300 | $22,970 |
| 2016 | $1,827 | $20,060 | $3,300 | $16,760 |
| 2015 | $1,868 | $15,900 | $2,970 | $12,930 |
| 2014 | $1,533 | $15,900 | $2,970 | $12,930 |
Source: Public Records
Map
Nearby Homes
- 8005 Emerald Ln
- 920 W 1st Ave
- 125 Laurel St
- 135 Garnet St
- 690 W 1st Ave
- 55 Emerald St
- 216 Hemlock St
- 123 Emerald St
- 290 Daphne Way
- 375 Hemlock St
- 126 Beryl Way
- 6801 W 118th Ave
- 255 Beryl Way
- 8361 Parkland St
- 11316 Colony Cir
- 11310 Colony Cir
- 11305 Uptown Ave
- 640 Kalmia Way
- 680 Kalmia Way
- 11267 Central Ct
- 7965 W 119th Ave
- 7893 W 119th Ave
- 7968 W 119th Place
- 11910 Allison St
- 7888 W 119th Place
- 7980 W 119th Place
- 11830 Allison St
- 7878 W 119th Place
- 7823 W 119th Ave
- 11923 Allison St
- 7895 W 119th Place
- 7830 W 119th Place
- 7875 W 119th Place
- 7970 W 120th Ave
- 7865 W 119th Place
- 7655 W 119th Ave
- 7690 W 119th Place
- 7845 W 119th Place
- 7910 W 120th Ave
- 7770 W 120th Ave