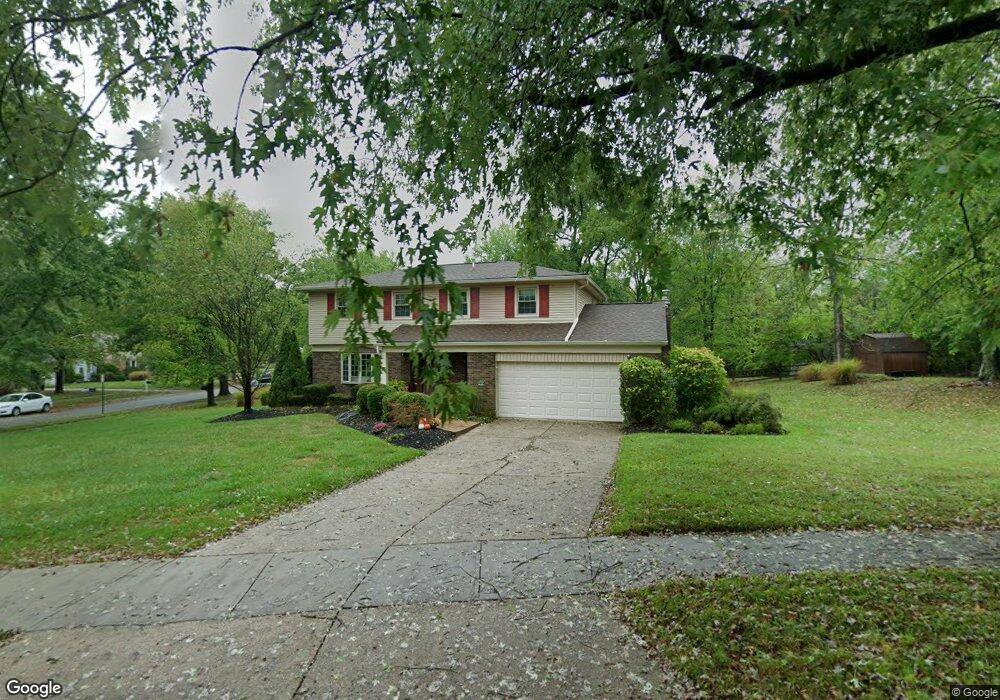
7948 Heatherglen Dr Cincinnati, OH 45255
Estimated Value: $395,429 - $485,000
4
Beds
3
Baths
2,614
Sq Ft
$164/Sq Ft
Est. Value
About This Home
This home is located at 7948 Heatherglen Dr, Cincinnati, OH 45255 and is currently estimated at $428,357, approximately $163 per square foot. 7948 Heatherglen Dr is a home located in Hamilton County with nearby schools including Wilson Elementary School, Nagel Middle School, and Turpin High School.
Ownership History
Date
Name
Owned For
Owner Type
Purchase Details
Closed on
Aug 30, 2005
Sold by
Kovach Scott C and Kovach Karen S
Bought by
Blamer Mike and Blamer Robin L
Current Estimated Value
Home Financials for this Owner
Home Financials are based on the most recent Mortgage that was taken out on this home.
Original Mortgage
$21,600
Outstanding Balance
$11,327
Interest Rate
5.93%
Mortgage Type
Credit Line Revolving
Estimated Equity
$417,030
Purchase Details
Closed on
Aug 27, 1999
Sold by
Halleck Donald R and Halleck Catherine A
Bought by
Kovach Scott C and Kovach Karen S
Home Financials for this Owner
Home Financials are based on the most recent Mortgage that was taken out on this home.
Original Mortgage
$148,000
Interest Rate
7%
Purchase Details
Closed on
Mar 10, 1995
Sold by
Reynolds James W and Reynolds Denise K
Bought by
Halleck Donald R and Halleck Catherine A
Home Financials for this Owner
Home Financials are based on the most recent Mortgage that was taken out on this home.
Original Mortgage
$132,900
Interest Rate
8.91%
Create a Home Valuation Report for This Property
The Home Valuation Report is an in-depth analysis detailing your home's value as well as a comparison with similar homes in the area
Home Values in the Area
Average Home Value in this Area
Purchase History
| Date | Buyer | Sale Price | Title Company |
|---|---|---|---|
| Blamer Mike | $218,000 | None Available | |
| Kovach Scott C | $164,900 | First Title Agency Inc | |
| Halleck Donald R | -- | -- |
Source: Public Records
Mortgage History
| Date | Status | Borrower | Loan Amount |
|---|---|---|---|
| Open | Blamer Mike | $21,600 | |
| Open | Blamer Mike | $174,400 | |
| Closed | Kovach Scott C | $148,000 | |
| Closed | Halleck Donald R | $132,900 |
Source: Public Records
Tax History
| Year | Tax Paid | Tax Assessment Tax Assessment Total Assessment is a certain percentage of the fair market value that is determined by local assessors to be the total taxable value of land and additions on the property. | Land | Improvement |
|---|---|---|---|---|
| 2025 | $6,437 | $102,921 | $17,780 | $85,141 |
| 2024 | $6,256 | $102,921 | $17,780 | $85,141 |
| 2023 | $5,951 | $102,921 | $17,780 | $85,141 |
| 2022 | $5,622 | $86,583 | $17,339 | $69,244 |
| 2021 | $5,489 | $86,583 | $17,339 | $69,244 |
| 2020 | $5,552 | $86,583 | $17,339 | $69,244 |
| 2019 | $5,014 | $70,970 | $14,214 | $56,756 |
| 2018 | $4,697 | $70,970 | $14,214 | $56,756 |
| 2017 | $4,430 | $70,970 | $14,214 | $56,756 |
| 2016 | $4,152 | $64,975 | $14,179 | $50,796 |
| 2015 | $4,033 | $64,975 | $14,179 | $50,796 |
| 2014 | $4,036 | $64,975 | $14,179 | $50,796 |
| 2013 | $3,742 | $63,700 | $13,902 | $49,798 |
Source: Public Records
Map
Nearby Homes
- 7926 Dunview Ct
- 1858 Foxhollow Dr
- 7660 Clough Pike
- 7652 Clough Pike
- 8146 Clough Pike
- 2106 Forestlake Dr
- 1786 Woodpine Ln
- 8022 Stonegate Dr
- 7712 Stonehill Dr
- 1847 Eight Mile Rd
- 1363 Oak Ct
- 1357 Oak Ct
- 1472 Sigma Cir
- 1400 Sigma Cir
- 1662 Hilltree Dr
- 2256 Endovalley Dr
- 1747 Summithills Dr
- 1750 Emerald Glade Ln
- 2274 Pointe Place
- 8488 Holiday Hills Dr
- 1812 Sandcliff Dr
- 7954 Heatherglen Dr
- 1826 Sandcliff Dr
- 7924 Heatherglen Dr
- 7941 Heatherglen Dr
- 7953 Heatherglen Dr
- 7966 Heatherglen Dr
- 7927 Heatherglen Dr
- 1836 Sandcliff Dr
- 1825 Sandcliff Dr
- 7965 Heatherglen Dr
- 7912 Heatherglen Dr
- 7977 Heatherglen Dr
- 7917 Heatherglen Dr
- 1835 Sandcliff Dr
- 7938 Dunview Ct
- 1847 Sandcliff Dr
- 7950 Dunview Ct
- 1793 Nagel Rd
- 1818 Stonehouse Ln
Your Personal Tour Guide
Ask me questions while you tour the home.