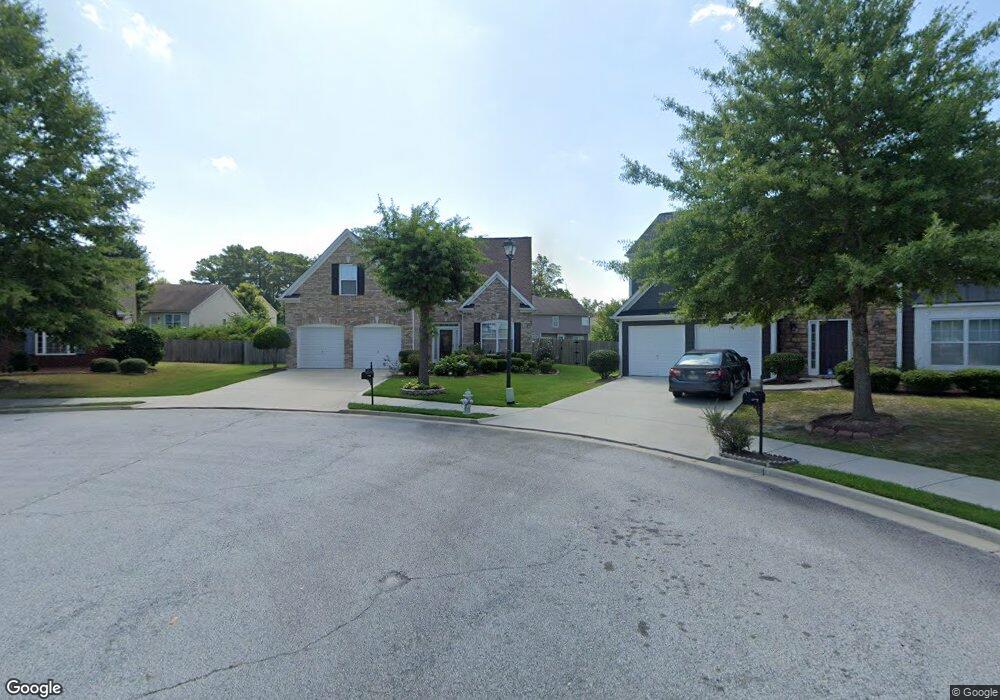
795 Boulder Trace Union City, GA 30291
Estimated Value: $290,000 - $337,000
4
Beds
3
Baths
2,617
Sq Ft
$117/Sq Ft
Est. Value
About This Home
This home is located at 795 Boulder Trace, Union City, GA 30291 and is currently estimated at $306,693, approximately $117 per square foot. 795 Boulder Trace is a home located in Fulton County with nearby schools including Oakley Elementary School, Bear Creek Middle School, and Creekside High School.
Ownership History
Date
Name
Owned For
Owner Type
Purchase Details
Closed on
Aug 10, 2006
Sold by
Bank Of New York Cwabs 2005
Bought by
Hamilton Norma
Current Estimated Value
Home Financials for this Owner
Home Financials are based on the most recent Mortgage that was taken out on this home.
Original Mortgage
$139,920
Outstanding Balance
$83,777
Interest Rate
6.71%
Mortgage Type
New Conventional
Estimated Equity
$222,916
Purchase Details
Closed on
Apr 4, 2006
Sold by
Johnson Terrance R and Johnson Sandy J
Bought by
Bank Of New York Cwmbs 2005 & Bc
Purchase Details
Closed on
Sep 30, 2003
Sold by
D R Horton Inc & Torrey
Bought by
Wilkinson Sandy J
Home Financials for this Owner
Home Financials are based on the most recent Mortgage that was taken out on this home.
Original Mortgage
$172,264
Interest Rate
5.93%
Mortgage Type
VA
Create a Home Valuation Report for This Property
The Home Valuation Report is an in-depth analysis detailing your home's value as well as a comparison with similar homes in the area
Home Values in the Area
Average Home Value in this Area
Purchase History
| Date | Buyer | Sale Price | Title Company |
|---|---|---|---|
| Hamilton Norma | $174,900 | -- | |
| Bank Of New York Cwmbs 2005 & Bc | $155,722 | -- | |
| Wilkinson Sandy J | $175,000 | -- |
Source: Public Records
Mortgage History
| Date | Status | Borrower | Loan Amount |
|---|---|---|---|
| Open | Hamilton Norma | $139,920 | |
| Previous Owner | Wilkinson Sandy J | $172,264 |
Source: Public Records
Tax History Compared to Growth
Tax History
| Year | Tax Paid | Tax Assessment Tax Assessment Total Assessment is a certain percentage of the fair market value that is determined by local assessors to be the total taxable value of land and additions on the property. | Land | Improvement |
|---|---|---|---|---|
| 2025 | $1,348 | $116,400 | $23,160 | $93,240 |
| 2023 | $1,348 | $132,120 | $33,040 | $99,080 |
| 2022 | $1,326 | $77,760 | $13,840 | $63,920 |
| 2021 | $1,179 | $75,480 | $13,440 | $62,040 |
| 2020 | $1,204 | $66,800 | $11,640 | $55,160 |
| 2019 | $1,558 | $59,760 | $10,280 | $49,480 |
| 2018 | $1,164 | $54,760 | $10,040 | $44,720 |
| 2017 | $1,373 | $50,760 | $14,080 | $36,680 |
| 2016 | $1,371 | $50,760 | $14,080 | $36,680 |
| 2015 | $1,377 | $50,760 | $14,080 | $36,680 |
| 2014 | $1,526 | $53,120 | $12,960 | $40,160 |
Source: Public Records
Map
Nearby Homes
- 7105 Boulder Pass
- 7125 Woodridge Ln
- 6340 Hickory Lane Cir
- 6338 Hickory Lane Cir
- 6229 Hickory Lane Cir
- 6231 Hickory Lane Cir
- 6271 Hickory Lane Cir
- 6256 Hickory Lane Cir
- 7259 Taloga Ln
- 4403 Pinscher St
- 4203 Jordans Bank
- 4509 Gideons Trace
- 310 Ashigan St
- 4509 Gideon's Trace
- 329 Ashigan St
- 328 Ashigan St
- 7317 Gossamer St
- 722 Keeshono St
- 785 Boulder Trace
- 7159 Flagstone Place
- 790 Boulder Trace
- 7163 Flagstone Place
- 7155 Flagstone Place
- 780 Boulder Trace
- 775 Boulder Trace
- 0 Flagstone Place Unit 8679725
- 0 Flagstone Place Unit 8395967
- 0 Flagstone Place Unit 8190889
- 0 Flagstone Place Unit 7642009
- 0 Flagstone Place Unit 8101722
- 0 Flagstone Place Unit 8370821
- 0 Flagstone Place Unit 8133960
- 0 Flagstone Place Unit 7546114
- 0 Flagstone Place Unit 7258928
- 0 Flagstone Place Unit 7163538
- 0 Flagstone Place Unit 8734459
- 0 Flagstone Place Unit 3280150
- 0 Flagstone Place Unit 7007527