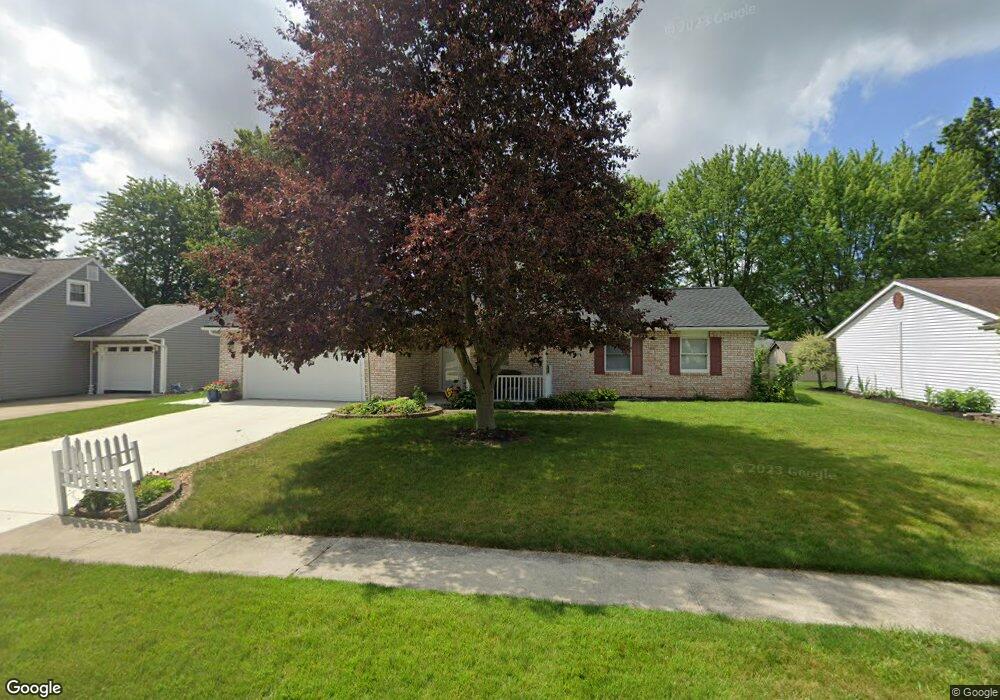
795 Coventry Green Saint Marys, OH 45885
Estimated Value: $202,615 - $247,000
3
Beds
2
Baths
1,394
Sq Ft
$160/Sq Ft
Est. Value
About This Home
This home is located at 795 Coventry Green, Saint Marys, OH 45885 and is currently estimated at $222,654, approximately $159 per square foot. 795 Coventry Green is a home located in Auglaize County with nearby schools including St. Mary's East Primary School, St. Mary's West Intermediate School, and St. Marys Middle School.
Ownership History
Date
Name
Owned For
Owner Type
Purchase Details
Closed on
Oct 3, 2016
Sold by
Lammers Marilyn Jean
Bought by
Lammers Marilyn Jean
Current Estimated Value
Purchase Details
Closed on
May 20, 2016
Sold by
French Craig D and French Angela S
Bought by
Lammers Marilyn Jean
Home Financials for this Owner
Home Financials are based on the most recent Mortgage that was taken out on this home.
Original Mortgage
$54,900
Interest Rate
3.59%
Mortgage Type
New Conventional
Purchase Details
Closed on
Apr 3, 2014
Sold by
Schroeder Alice C
Bought by
French Craig D and French Angela S
Home Financials for this Owner
Home Financials are based on the most recent Mortgage that was taken out on this home.
Original Mortgage
$105,061
Interest Rate
3.87%
Mortgage Type
FHA
Purchase Details
Closed on
Jul 25, 2001
Sold by
Meinerding David L
Bought by
Schroeder John R
Create a Home Valuation Report for This Property
The Home Valuation Report is an in-depth analysis detailing your home's value as well as a comparison with similar homes in the area
Home Values in the Area
Average Home Value in this Area
Purchase History
| Date | Buyer | Sale Price | Title Company |
|---|---|---|---|
| Lammers Marilyn Jean | -- | Attorney | |
| Lammers Marilyn Jean | $124,900 | Attorney | |
| French Craig D | $107,000 | Hallmark Title | |
| Schroeder John R | $115,900 | -- |
Source: Public Records
Mortgage History
| Date | Status | Borrower | Loan Amount |
|---|---|---|---|
| Previous Owner | Lammers Marilyn Jean | $54,900 | |
| Previous Owner | French Craig D | $105,061 |
Source: Public Records
Tax History Compared to Growth
Tax History
| Year | Tax Paid | Tax Assessment Tax Assessment Total Assessment is a certain percentage of the fair market value that is determined by local assessors to be the total taxable value of land and additions on the property. | Land | Improvement |
|---|---|---|---|---|
| 2024 | $3,587 | $50,490 | $9,140 | $41,350 |
| 2023 | $1,865 | $50,490 | $9,140 | $41,350 |
| 2022 | $1,757 | $42,550 | $8,340 | $34,210 |
| 2021 | $1,737 | $42,550 | $8,340 | $34,210 |
| 2020 | $880 | $42,553 | $8,344 | $34,209 |
| 2019 | $1,521 | $35,872 | $7,035 | $28,837 |
| 2018 | $1,521 | $35,872 | $7,035 | $28,837 |
| 2017 | $1,523 | $35,872 | $7,035 | $28,837 |
| 2016 | $1,426 | $33,702 | $6,570 | $27,132 |
| 2015 | $1,394 | $33,702 | $6,570 | $27,132 |
| 2014 | $1,045 | $33,702 | $6,570 | $27,132 |
| 2013 | $1,081 | $33,702 | $6,570 | $27,132 |
Source: Public Records
Map
Nearby Homes
- 332 Miami Erie Cir
- 324 Miami Erie Cir
- 308 Miami Erie Cir
- 316 Miami Erie Cir
- 317 Miami Erie Cir
- 345 Miami Erie Cir
- 313 Miami Erie Cir
- 375 Miami Erie Cir
- 341 Miami Erie Cir
- 385 Miami Erie Cir
- 367 Miami Erie Cir
- 309 Miami Erie Cir
- 520 Oil St
- 357 Miami Erie Cir
- 374 Miami Erie Cir
- 364 Miami Erie Cir
- 366 Miami Erie Cir
- 386 Miami Erie Cir
- 390 Miami Erie Cir
- 363 Miami Erie Cir
- 793 Coventry Green
- 797 Coventry Green
- 794 Gordon Grove
- 792 Gordon Grove
- 798 Coventry Green
- 691 Coventry Green
- 796 Gordon Grove
- 796 Coventry Green
- 798 Gordon Grove
- 792 Coventry Green
- 689 Coventry Green
- 803 Bryarly Cir
- 790 Coventry Green
- 794 Coventry Green
- 691 Gordon Grove Ave
- 691 Gordon Grove Ave
- 691 Gordon Grove Ave
- 691 Gordon Grove Ave
- 691 Gordon Grove Ave Unit 691 B
- 801 Bryarly Cir