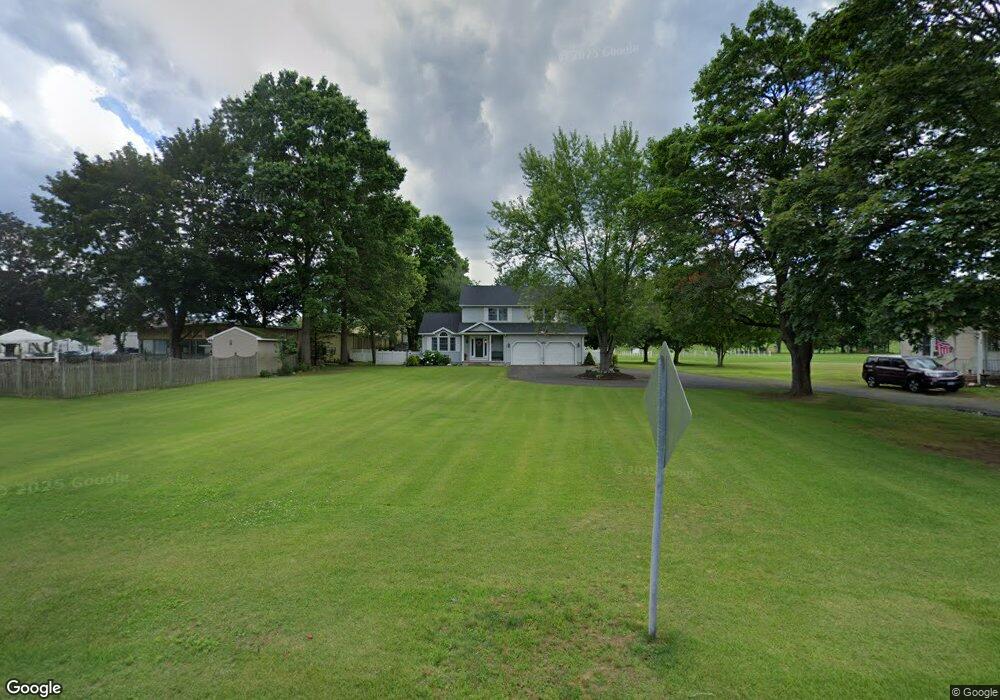
795 East St N Suffield, CT 06078
Estimated Value: $503,000 - $530,000
3
Beds
4
Baths
2,024
Sq Ft
$253/Sq Ft
Est. Value
About This Home
This home is located at 795 East St N, Suffield, CT 06078 and is currently estimated at $512,186, approximately $253 per square foot. 795 East St N is a home located in Hartford County with nearby schools including A. Ward Spaulding School, Mcalister Intermediate School, and Suffield Middle School.
Ownership History
Date
Name
Owned For
Owner Type
Purchase Details
Closed on
Nov 19, 2018
Sold by
James Fleming T
Bought by
Fleming Shaun B
Current Estimated Value
Purchase Details
Closed on
Aug 30, 2017
Sold by
Morin Kathleen F
Bought by
Morin William E and Morin Kathleen F
Purchase Details
Closed on
Mar 9, 2017
Sold by
James Fleming Ft
Bought by
Fleming Shaun B
Purchase Details
Closed on
Mar 5, 2012
Sold by
Est Fleming James E
Bought by
Marital James Fleming and Butler Daniel J
Create a Home Valuation Report for This Property
The Home Valuation Report is an in-depth analysis detailing your home's value as well as a comparison with similar homes in the area
Home Values in the Area
Average Home Value in this Area
Purchase History
| Date | Buyer | Sale Price | Title Company |
|---|---|---|---|
| Fleming Shaun B | -- | -- | |
| Morin William E | -- | -- | |
| Fleming Shaun B | -- | -- | |
| Morin Kathleen F | -- | -- | |
| Marital James Fleming | -- | -- |
Source: Public Records
Tax History
| Year | Tax Paid | Tax Assessment Tax Assessment Total Assessment is a certain percentage of the fair market value that is determined by local assessors to be the total taxable value of land and additions on the property. | Land | Improvement |
|---|---|---|---|---|
| 2025 | $6,776 | $289,450 | $57,960 | $231,490 |
| 2024 | $6,550 | $289,450 | $57,960 | $231,490 |
| 2023 | $5,618 | $196,350 | $58,030 | $138,320 |
| 2022 | $5,618 | $196,350 | $58,030 | $138,320 |
| 2021 | $5,623 | $196,350 | $58,030 | $138,320 |
| 2020 | $5,623 | $196,350 | $58,030 | $138,320 |
| 2019 | $5,639 | $196,350 | $58,030 | $138,320 |
| 2018 | $5,704 | $194,530 | $55,720 | $138,810 |
| 2017 | $6,217 | $215,180 | $76,370 | $138,810 |
| 2016 | $6,068 | $215,180 | $76,370 | $138,810 |
| 2015 | $5,978 | $215,180 | $76,370 | $138,810 |
| 2014 | $5,836 | $215,180 | $76,370 | $138,810 |
Source: Public Records
Map
Nearby Homes
- 45 Douglas St
- 98 1st St
- 230 E Bass Ln
- 105 1st St
- 147 W Grayling Ln
- 3 Pebblestone Cir Unit 3
- 56 S River St
- 57 Asnuntuck St
- 17 Heather Ln
- 80 S River St
- 38 Church St
- 40 Church St
- 97 Pleasant St
- 148 Pleasant St
- 47 Maple Ave
- 39 Union Street Extension
- 41 Walnut St
- 278 Thompsonville Rd
- 54 Hartford Ave
- 9 Warriner Ave
Your Personal Tour Guide
Ask me questions while you tour the home.