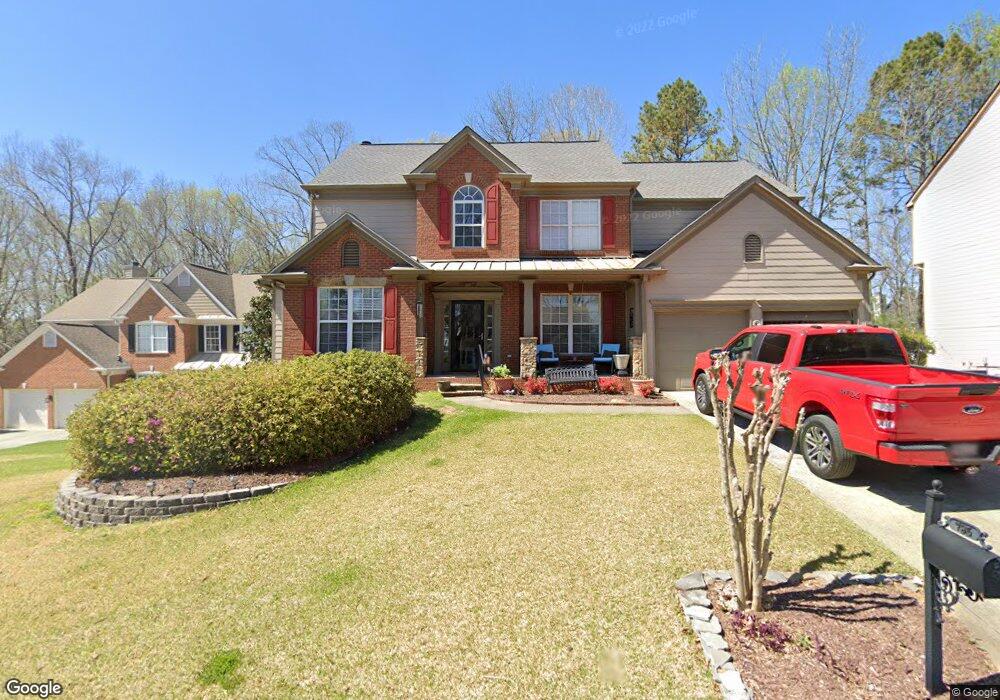
795 Ellsborough Ct Alpharetta, GA 30005
Wellington NeighborhoodEstimated Value: $676,000 - $788,000
3
Beds
3
Baths
3,328
Sq Ft
$218/Sq Ft
Est. Value
About This Home
This home is located at 795 Ellsborough Ct, Alpharetta, GA 30005 and is currently estimated at $725,035, approximately $217 per square foot. 795 Ellsborough Ct is a home located in Fulton County with nearby schools including Taylor Road Middle School, Chattahoochee High School, and Cresco Montessori School - Johns Creek Campus.
Ownership History
Date
Name
Owned For
Owner Type
Purchase Details
Closed on
May 12, 2003
Sold by
Poole Robert E and Poole Stacy L
Bought by
Deutscher Nancy E and Deutscher Andrew
Current Estimated Value
Home Financials for this Owner
Home Financials are based on the most recent Mortgage that was taken out on this home.
Original Mortgage
$207,600
Outstanding Balance
$80,065
Interest Rate
4.25%
Mortgage Type
New Conventional
Estimated Equity
$644,970
Purchase Details
Closed on
Jan 20, 1999
Sold by
Pulte Home Corp
Bought by
Poole Robert E and Poole Stacy L
Home Financials for this Owner
Home Financials are based on the most recent Mortgage that was taken out on this home.
Original Mortgage
$200,340
Interest Rate
6.72%
Mortgage Type
New Conventional
Create a Home Valuation Report for This Property
The Home Valuation Report is an in-depth analysis detailing your home's value as well as a comparison with similar homes in the area
Home Values in the Area
Average Home Value in this Area
Purchase History
| Date | Buyer | Sale Price | Title Company |
|---|---|---|---|
| Deutscher Nancy E | $259,500 | -- | |
| Poole Robert E | $222,600 | -- |
Source: Public Records
Mortgage History
| Date | Status | Borrower | Loan Amount |
|---|---|---|---|
| Open | Deutscher Nancy E | $207,600 | |
| Previous Owner | Poole Robert E | $200,340 |
Source: Public Records
Tax History Compared to Growth
Tax History
| Year | Tax Paid | Tax Assessment Tax Assessment Total Assessment is a certain percentage of the fair market value that is determined by local assessors to be the total taxable value of land and additions on the property. | Land | Improvement |
|---|---|---|---|---|
| 2025 | $4,653 | $272,800 | $54,320 | $218,480 |
| 2023 | $8,464 | $299,880 | $54,320 | $245,560 |
| 2022 | $4,467 | $230,120 | $32,360 | $197,760 |
| 2021 | $4,404 | $171,840 | $26,960 | $144,880 |
| 2020 | $3,838 | $153,680 | $25,360 | $128,320 |
| 2019 | $470 | $151,600 | $24,920 | $126,680 |
| 2018 | $3,979 | $140,440 | $20,680 | $119,760 |
| 2017 | $3,781 | $125,200 | $17,880 | $107,320 |
| 2016 | $3,700 | $125,200 | $17,880 | $107,320 |
| 2015 | $3,704 | $123,640 | $17,880 | $105,760 |
| 2014 | $3,391 | $109,200 | $15,800 | $93,400 |
Source: Public Records
Map
Nearby Homes
- 775 Ellsborough Ct
- 130 Wyndlam Ct
- 11260 Donnington Dr
- 11615 Windbrooke Way
- 11420 Crossington Rd
- 5610 N Hillbrooke Trace
- 1660 Gladewood Dr
- 5785 Oxborough Way Unit 1
- 640 Arncliffe Ct Unit 1
- 5575 Ashwind Trace
- 230 Sessingham Ln
- 5325 Hillgate Crossing
- 5680 Abbotts Bridge Rd
- 5690 Abbotts Bridge Rd
- 335 Dunhill Way Ct
- 11235 Surrey Park Trail
- 805 Ellsborough Ct Unit 3
- 785 Ellsborough Ct
- 815 Ellsborough Ct
- 780 Ellsborough Ct Unit 780
- 780 Ellsborough Ct
- 780 Ellsborough Ct Unit II
- 770 Ellsborough Ct
- 5510 Oxborough Way
- 790 Ellsborough Ct Unit 3
- 760 Ellsborough Ct
- 765 Ellsborough Ct
- 5520 Oxborough Way
- 810 Ellsborough Ct Unit III
- 750 Ellsborough Ct Unit 3
- 800 Ellsborough Ct Unit III
- 11270 Crossington Rd
- 5530 Oxborough Way Unit 3
- 11260 Crossington Rd
- 11280 Crossington Rd
- 11290 Crossington Rd