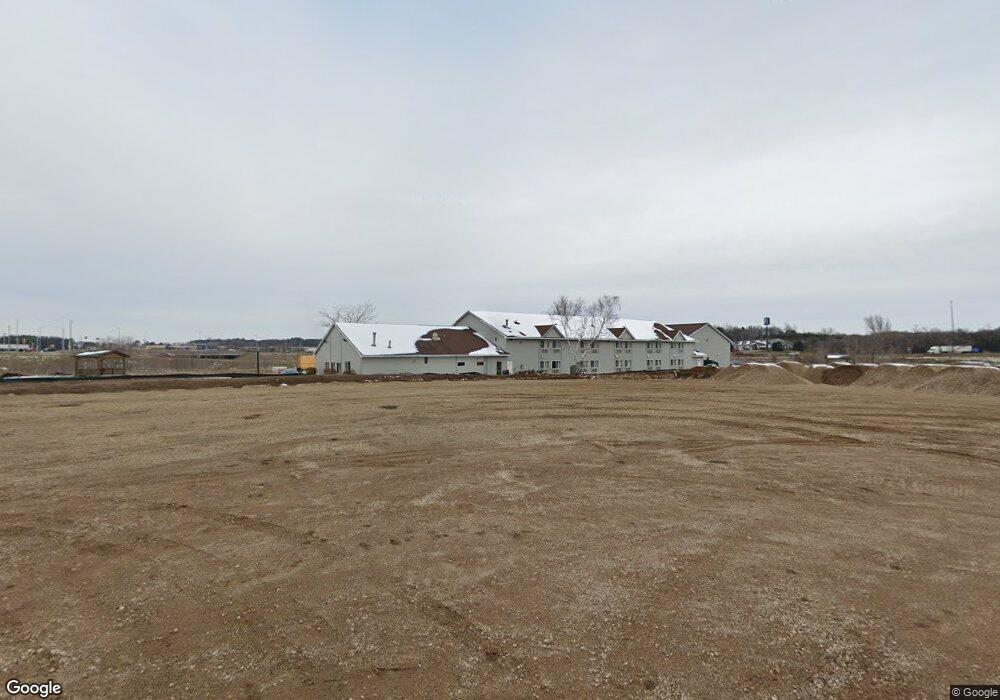
795 Energy St Baldwin, WI 54002
Estimated Value: $428,000 - $603,940
Studio
--
Bath
--
Sq Ft
184,259
Sq Ft
About This Home
This home is located at 795 Energy St, Baldwin, WI 54002 and is currently estimated at $515,970. 795 Energy St is a home located in St. Croix County with nearby schools including Greenfield Elementary School, Viking Middle School, and Baldwin-Woodville High School.
Ownership History
Date
Name
Owned For
Owner Type
Purchase Details
Closed on
Dec 4, 2020
Sold by
Singh Bhupinder
Bought by
Mid America Stores Llc
Current Estimated Value
Purchase Details
Closed on
Jul 28, 2017
Sold by
Pk Manak Inc
Bought by
Singh Bhupinder
Purchase Details
Closed on
Mar 22, 2013
Sold by
First Bank Of Baldwin
Bought by
Pk Manak Inc
Purchase Details
Closed on
Dec 27, 2011
Sold by
Wynveen Kent M and Wynveen Shelley L
Bought by
First Bank Of Baldwin
Purchase Details
Closed on
May 14, 2008
Sold by
Alreich Enterprises Llc
Bought by
Kabir Pramukh Hospitality Llc
Purchase Details
Closed on
Oct 25, 2007
Sold by
Reich James A
Bought by
Wynveen Kent M and Wynveen Shelley L
Home Financials for this Owner
Home Financials are based on the most recent Mortgage that was taken out on this home.
Original Mortgage
$919,166
Interest Rate
6.44%
Mortgage Type
Future Advance Clause Open End Mortgage
Create a Home Valuation Report for This Property
The Home Valuation Report is an in-depth analysis detailing your home's value as well as a comparison with similar homes in the area
Home Values in the Area
Average Home Value in this Area
Purchase History
| Date | Buyer | Sale Price | Title Company |
|---|---|---|---|
| Mid America Stores Llc | $450,000 | Land Title | |
| Singh Bhupinder | $55,000 | Title One Premier Group | |
| Pk Manak Inc | $200,000 | None Available | |
| First Bank Of Baldwin | $700,000 | None Available | |
| Kabir Pramukh Hospitality Llc | -- | None Available | |
| Wynveen Kent M | -- | None Available |
Source: Public Records
Mortgage History
| Date | Status | Borrower | Loan Amount |
|---|---|---|---|
| Previous Owner | Wynveen Kent M | $919,166 |
Source: Public Records
Tax History
| Year | Tax Paid | Tax Assessment Tax Assessment Total Assessment is a certain percentage of the fair market value that is determined by local assessors to be the total taxable value of land and additions on the property. | Land | Improvement |
|---|---|---|---|---|
| 2025 | $5,464 | $266,400 | $266,400 | $0 |
| 2024 | $52 | $266,400 | $266,400 | $0 |
| 2023 | $4,419 | $266,400 | $266,400 | $0 |
| 2022 | $4,355 | $266,400 | $266,400 | $0 |
| 2021 | $1,841 | $266,400 | $266,400 | $0 |
| 2020 | $1,793 | $78,800 | $78,800 | $0 |
| 2019 | $1,797 | $78,800 | $78,800 | $0 |
| 2018 | $3,200 | $84,000 | $78,800 | $5,200 |
| 2017 | $3,400 | $161,600 | $135,700 | $25,900 |
| 2016 | $3,400 | $161,600 | $135,700 | $25,900 |
| 2015 | $4,928 | $200,000 | $50,000 | $150,000 |
| 2014 | $4,719 | $200,000 | $50,000 | $150,000 |
| 2013 | $10,233 | $200,000 | $50,000 | $150,000 |
Source: Public Records
Map
Nearby Homes
- 2111 55th Ave
- 2081 60th Ave
- 1710 Amsterdam St
- 330 Meadowview Ct
- 300 Cedar St Unit 15
- 384 Cedar St
- 1724 Redhead Ave
- xxx 11th Ave
- 316 Birch St
- 288 Birch St
- 313 Birch St
- 1586 Mallard Ave
- 1621 Mallard Ave
- 1632 Mallard Ave
- 1629 Mallard Ave
- 1617 Mallard Ave
- 199 Wood Duck Ln
- 233 Pintail St
- 183 Pintail St
- 180 Pintail St
Your Personal Tour Guide
Ask me questions while you tour the home.