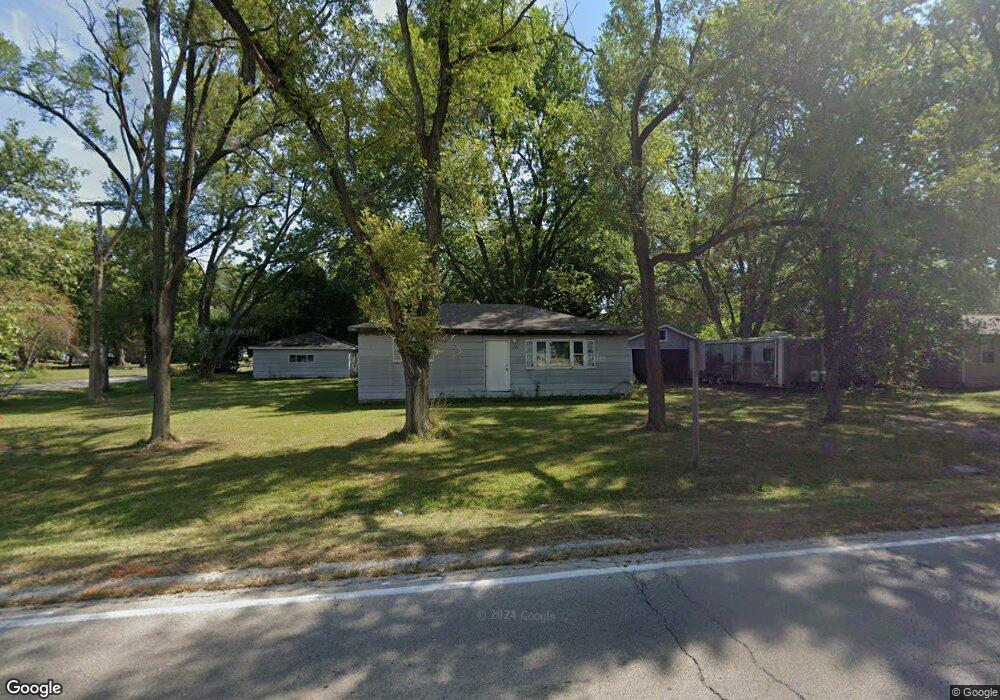
795 N Division St Braidwood, IL 60408
Estimated Value: $203,369 - $231,000
--
Bed
--
Bath
--
Sq Ft
0.36
Acres
About This Home
This home is located at 795 N Division St, Braidwood, IL 60408 and is currently estimated at $216,592. 795 N Division St is a home located in Will County with nearby schools including Reed-Custer Intermediate School, Reed-Custer Middle School, and Reed-Custer High School.
Ownership History
Date
Name
Owned For
Owner Type
Purchase Details
Closed on
Feb 10, 2022
Sold by
Elizabeth Blish
Bought by
Blish Richard
Current Estimated Value
Purchase Details
Closed on
Sep 15, 2003
Sold by
Standard Bank & Trust Co
Bought by
Wheeler Terry
Home Financials for this Owner
Home Financials are based on the most recent Mortgage that was taken out on this home.
Original Mortgage
$81,175
Interest Rate
7.35%
Mortgage Type
Purchase Money Mortgage
Purchase Details
Closed on
Apr 29, 2003
Sold by
Dinkins Deborah A
Bought by
Standard Bank & Trust Co
Purchase Details
Closed on
Feb 27, 2003
Sold by
Dinkins Deborah A and Amerifed Bank Fsb
Bought by
Standard Bank & Trust and Trust #16560
Purchase Details
Closed on
May 11, 1994
Sold by
Zeb Dennis R
Bought by
Dinkins Robert L and Dinkins Deborah A
Home Financials for this Owner
Home Financials are based on the most recent Mortgage that was taken out on this home.
Original Mortgage
$47,350
Interest Rate
8.08%
Mortgage Type
Assumption
Create a Home Valuation Report for This Property
The Home Valuation Report is an in-depth analysis detailing your home's value as well as a comparison with similar homes in the area
Home Values in the Area
Average Home Value in this Area
Purchase History
| Date | Buyer | Sale Price | Title Company |
|---|---|---|---|
| Blish Richard | -- | Blacha Law Office Llc | |
| Wheeler Terry | $95,500 | Ticor Title | |
| Standard Bank & Trust Co | -- | -- | |
| Standard Bank & Trust | $62,860 | -- | |
| Dinkins Robert L | $46,000 | -- |
Source: Public Records
Mortgage History
| Date | Status | Borrower | Loan Amount |
|---|---|---|---|
| Previous Owner | Wheeler Terry | $81,175 | |
| Previous Owner | Dinkins Robert L | $47,350 |
Source: Public Records
Tax History Compared to Growth
Tax History
| Year | Tax Paid | Tax Assessment Tax Assessment Total Assessment is a certain percentage of the fair market value that is determined by local assessors to be the total taxable value of land and additions on the property. | Land | Improvement |
|---|---|---|---|---|
| 2024 | $2,692 | $48,104 | $10,141 | $37,963 |
| 2023 | $2,692 | $43,085 | $9,083 | $34,002 |
| 2022 | $2,291 | $39,097 | $8,242 | $30,855 |
| 2021 | $2,207 | $37,317 | $7,867 | $29,450 |
| 2020 | $2,072 | $35,354 | $7,453 | $27,901 |
| 2019 | $1,941 | $33,385 | $7,038 | $26,347 |
| 2018 | $1,855 | $31,947 | $6,735 | $25,212 |
| 2017 | $1,815 | $31,321 | $6,603 | $24,718 |
| 2016 | $1,760 | $30,291 | $6,386 | $23,905 |
| 2015 | -- | $29,509 | $6,221 | $23,288 |
| 2014 | -- | $29,509 | $6,221 | $23,288 |
| 2013 | -- | $31,560 | $6,653 | $24,907 |
Source: Public Records
Map
Nearby Homes
- 495 W 6th St
- 605 N Division St
- 430 W 7th St
- 584 N Division St
- 0000 N Division St
- 495 N Division St
- 470 N Walker St
- 642 W Bergera Rd
- 466 N Walker St
- 460 N School St
- 470 N School St
- 571 N Lincoln St
- 340 N Walker St
- 837 Blackhawk Dr
- 886 Western Ave
- 999 W Cermak Rd
- 1021 W Cermak Rd
- 1034 Madison Ave
- 1018 Madison Ave
- 000 W Cermak Rd