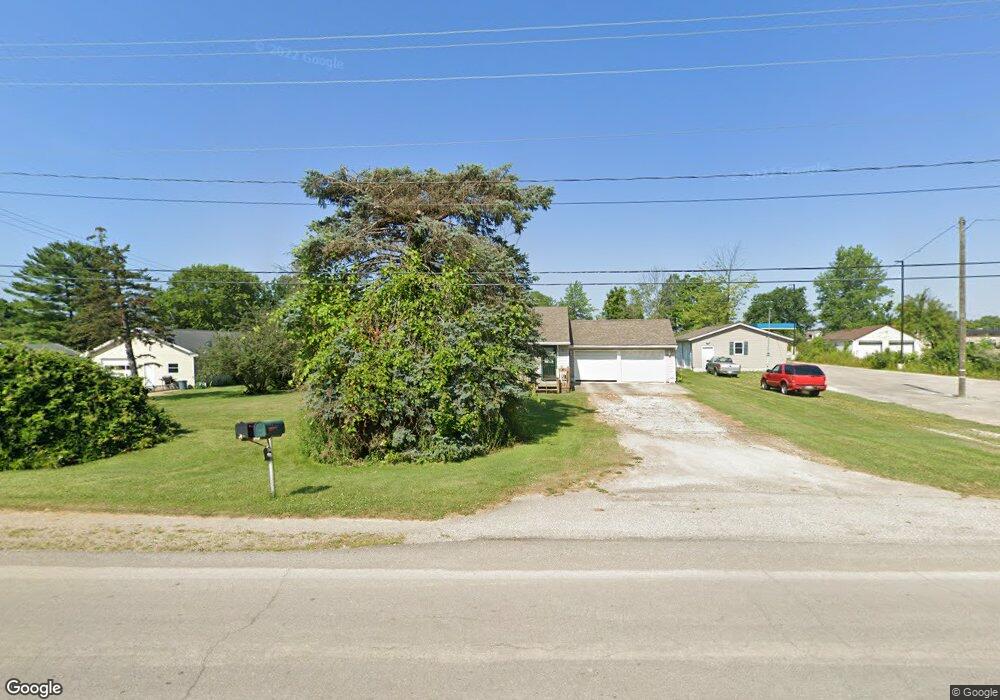
795 N Mcelroy Rd Mansfield, OH 44905
Estimated Value: $210,782 - $251,000
3
Beds
2
Baths
1,616
Sq Ft
$138/Sq Ft
Est. Value
About This Home
This home is located at 795 N Mcelroy Rd, Mansfield, OH 44905 and is currently estimated at $223,696, approximately $138 per square foot. 795 N Mcelroy Rd is a home located in Richland County with nearby schools including Madison High School, St. Mary Catholic School, and Temple-Christian School.
Ownership History
Date
Name
Owned For
Owner Type
Purchase Details
Closed on
Sep 15, 2016
Sold by
Butterbaugh Danny R and Butterbaugh Jeri L
Bought by
Butterbaugh Danny R and Butterbaugh Jeri L
Current Estimated Value
Purchase Details
Closed on
Sep 9, 2005
Sold by
Axn Investments Ltd
Bought by
Butterbaugh Danny R and Butterbaugh Jeri L
Home Financials for this Owner
Home Financials are based on the most recent Mortgage that was taken out on this home.
Original Mortgage
$89,900
Outstanding Balance
$43,017
Interest Rate
4.2%
Mortgage Type
Fannie Mae Freddie Mac
Estimated Equity
$180,679
Purchase Details
Closed on
Apr 30, 2004
Sold by
Jp Morgan Chase Bank
Bought by
Anx Investment Ltd
Purchase Details
Closed on
Jan 12, 2004
Sold by
Vollmer Vicky B
Bought by
Mortgage Electronic Registration Systems
Purchase Details
Closed on
Dec 24, 1991
Sold by
Harris Clifford J
Bought by
Ball Vickie B
Create a Home Valuation Report for This Property
The Home Valuation Report is an in-depth analysis detailing your home's value as well as a comparison with similar homes in the area
Home Values in the Area
Average Home Value in this Area
Purchase History
| Date | Buyer | Sale Price | Title Company |
|---|---|---|---|
| Butterbaugh Danny R | -- | Chicago Title | |
| Butterbaugh Danny R | $114,900 | Chicago Title | |
| Anx Investment Ltd | $27,000 | Multiple | |
| Jp Morgan Chase Bank | -- | Multiple | |
| Mortgage Electronic Registration Systems | $39,000 | Multiple | |
| Ball Vickie B | $52,000 | -- |
Source: Public Records
Mortgage History
| Date | Status | Borrower | Loan Amount |
|---|---|---|---|
| Open | Butterbaugh Danny R | $89,900 |
Source: Public Records
Tax History Compared to Growth
Tax History
| Year | Tax Paid | Tax Assessment Tax Assessment Total Assessment is a certain percentage of the fair market value that is determined by local assessors to be the total taxable value of land and additions on the property. | Land | Improvement |
|---|---|---|---|---|
| 2024 | $1,986 | $48,740 | $8,260 | $40,480 |
| 2023 | $1,892 | $48,740 | $8,260 | $40,480 |
| 2022 | $1,601 | $38,000 | $7,380 | $30,620 |
| 2021 | $1,601 | $38,000 | $7,380 | $30,620 |
| 2020 | $1,613 | $38,000 | $7,380 | $30,620 |
| 2019 | $1,489 | $32,740 | $6,250 | $26,490 |
| 2018 | $1,899 | $32,740 | $6,250 | $26,490 |
| 2017 | $2,160 | $32,740 | $6,250 | $26,490 |
| 2016 | $2,460 | $29,540 | $5,940 | $23,600 |
| 2015 | $2,380 | $29,540 | $5,430 | $24,110 |
| 2014 | $2,902 | $29,540 | $5,430 | $24,110 |
| 2012 | $2,093 | $29,540 | $5,720 | $23,820 |
Source: Public Records
Map
Nearby Homes
- 683 Coachman Rd
- 671 Coachman Rd
- 1226 Evergreen Ave W
- 1282 Redman Ave
- 632 Coachman Rd
- 602 Champion Rd
- 644 Skyline Rd
- 1199 Evergreen Ave W
- 1183 Evergreen Ave W
- 903 Mayflower Ave
- 1007 Delwood Rd
- 536 Gordon Rd
- 1151 Beal Rd
- 419 N Mcelroy Rd
- 1158 Delwood Rd
- 735 Pennsylvania Ave
- 588 Michigan Ave
- 1245 N Stewart Rd
- 0 Grace St
- 1806 Richard Dr
- 787 N Mcelroy Rd
- 781 N Mcelroy Rd
- 813 N Mcelroy Rd
- 798 N Mcelroy Rd
- 806 N Mcelroy Rd
- 773 N Mcelroy Rd
- 821 N Mcelroy Rd
- 1425 Us Rt 42
- 1175 Betchel Ave
- 1310 Ashland Rd
- 816 N Mcelroy Rd
- 778 N Mcelroy Rd
- 1304 Ashland Rd
- 755 N Mcelroy Rd
- 828 N Mcelroy Rd
- 1316 Ashland Rd
- 836 N Mcelroy Rd
- 746 N Mcelroy Rd
- 1288 Ashland Rd
- 1278 Ashland Rd