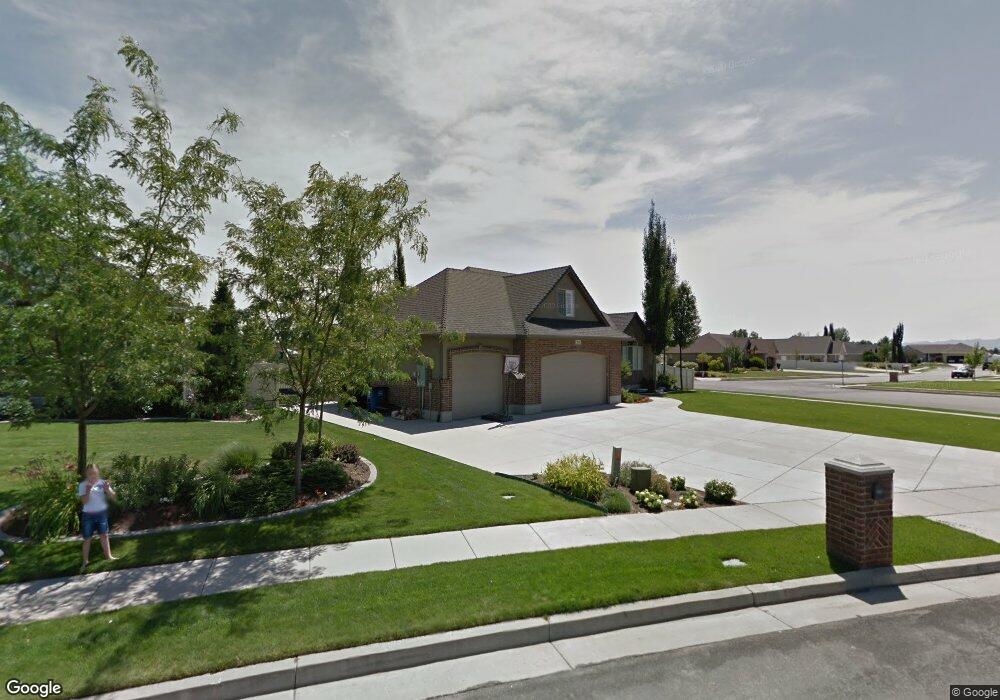
795 Peter Dr Kaysville, UT 84037
West Kaysville NeighborhoodEstimated Value: $885,000 - $997,810
5
Beds
4
Baths
2,289
Sq Ft
$411/Sq Ft
Est. Value
About This Home
This home is located at 795 Peter Dr, Kaysville, UT 84037 and is currently estimated at $939,703, approximately $410 per square foot. 795 Peter Dr is a home located in Davis County with nearby schools including Kaysville Elementary School, Farmington High, and Centennial Junior High School.
Ownership History
Date
Name
Owned For
Owner Type
Purchase Details
Closed on
Jan 11, 2021
Sold by
Jacobs Mason L
Bought by
Jacobs Mason L and Jacobs Janelle L
Current Estimated Value
Home Financials for this Owner
Home Financials are based on the most recent Mortgage that was taken out on this home.
Original Mortgage
$215,500
Outstanding Balance
$191,894
Interest Rate
2.71%
Mortgage Type
New Conventional
Estimated Equity
$747,809
Purchase Details
Closed on
Mar 15, 2005
Sold by
Lodder Homes Inc
Bought by
Jacobs Mason L and Jacobs Janelle L
Home Financials for this Owner
Home Financials are based on the most recent Mortgage that was taken out on this home.
Original Mortgage
$240,900
Interest Rate
5.61%
Mortgage Type
New Conventional
Purchase Details
Closed on
Aug 9, 2003
Sold by
Lodder C P
Bought by
Lodder Homes Inc
Create a Home Valuation Report for This Property
The Home Valuation Report is an in-depth analysis detailing your home's value as well as a comparison with similar homes in the area
Home Values in the Area
Average Home Value in this Area
Purchase History
| Date | Buyer | Sale Price | Title Company |
|---|---|---|---|
| Jacobs Mason L | -- | Accommodation | |
| Jacobs Mason L | -- | Paramount Title Corp | |
| Jacobs Mason L | -- | None Available | |
| Lodder Homes Inc | -- | -- |
Source: Public Records
Mortgage History
| Date | Status | Borrower | Loan Amount |
|---|---|---|---|
| Open | Jacobs Mason L | $215,500 | |
| Closed | Jacobs Mason L | $240,900 | |
| Closed | Jacobs Mason L | $260,000 |
Source: Public Records
Tax History Compared to Growth
Tax History
| Year | Tax Paid | Tax Assessment Tax Assessment Total Assessment is a certain percentage of the fair market value that is determined by local assessors to be the total taxable value of land and additions on the property. | Land | Improvement |
|---|---|---|---|---|
| 2025 | $4,397 | $487,300 | $225,552 | $261,748 |
| 2024 | $4,397 | $463,651 | $222,426 | $241,225 |
| 2023 | $4,359 | $814,000 | $384,015 | $429,985 |
| 2022 | $4,405 | $461,450 | $208,997 | $252,453 |
| 2021 | $3,981 | $625,000 | $258,687 | $366,313 |
| 2020 | $3,617 | $553,000 | $222,986 | $330,014 |
| 2019 | $3,510 | $527,000 | $215,602 | $311,398 |
| 2018 | $3,220 | $482,000 | $185,322 | $296,678 |
| 2016 | $2,860 | $225,060 | $89,590 | $135,470 |
| 2015 | $2,870 | $214,390 | $89,590 | $124,800 |
| 2014 | $2,779 | $211,415 | $67,211 | $144,204 |
| 2013 | -- | $183,768 | $53,313 | $130,455 |
Source: Public Records
Map
Nearby Homes
- 52 S Grandison Ct E Unit 83-R
- 1346 W Blackbird Ln Unit 3
- 109 S Rock Loft Ridge Dr Unit 56-R
- 159 S Rock Loft Ridge Dr Unit 59-R
- 209 N Rock Loft Ridge E Unit 32-R
- 180 S Rock Loft Ridge Dr E Unit 7-R
- 246 N Rock Loft Ridge Dr Unit 36-R
- 22 S Rock Loft Ridge Dr Unit 16-R
- 34 S Rock Loft Ridge Dr Unit 85-R
- 190 N Rock Loft Ridge Dr Unit 40-R
- 75 S Grandison Ct E Unit 69-R
- 93 S Rock Loft Ridge Dr Unit 55-R
- 167 S Grandison E Unit 74-R
- 127 S Rock Loft Ridge Dr Unit 57-R
- 28 N Rock Loft Ridge Dr Unit 46-R
- 96 S Rock Loft Ridge Dr Unit 12-R
- 67 S Rock Loft Ridge Dr Unit 53-R
- 86 S Grandison Ct E Unit 79-R
- 198 S Rock Loft Ridge Dr E Unit 6-R
- 454 S Jay St W