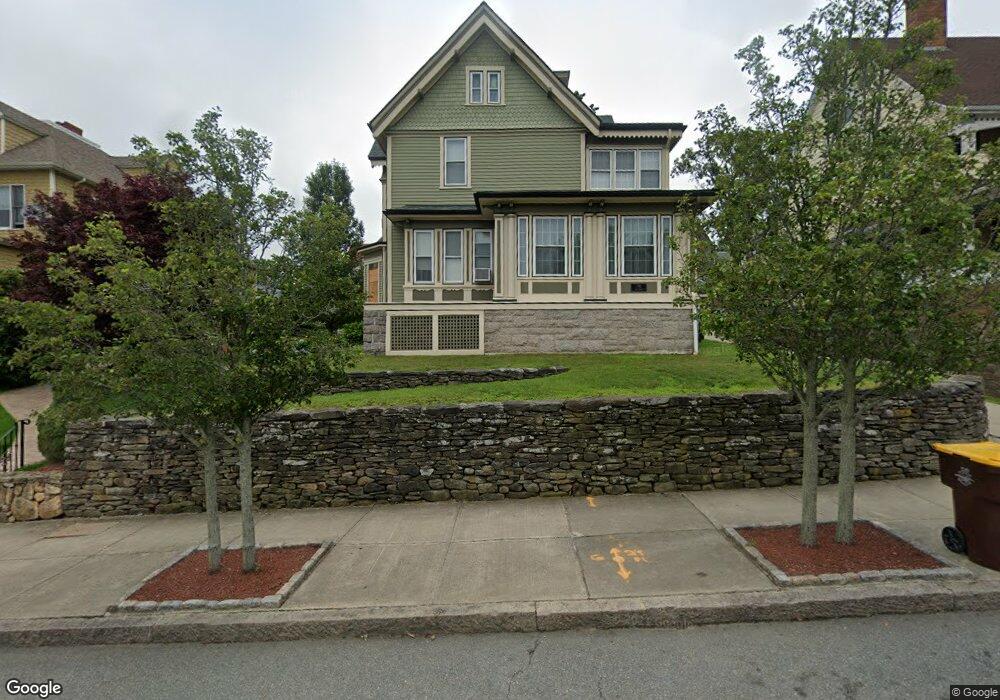
795 Rock St Fall River, MA 02720
Lower Highlands NeighborhoodEstimated Value: $463,844 - $592,000
5
Beds
3
Baths
2,939
Sq Ft
$178/Sq Ft
Est. Value
About This Home
This home is located at 795 Rock St, Fall River, MA 02720 and is currently estimated at $523,211, approximately $178 per square foot. 795 Rock St is a home located in Bristol County with nearby schools including Mary Fonseca Elementary School, Morton Middle School, and B M C Durfee High School.
Ownership History
Date
Name
Owned For
Owner Type
Purchase Details
Closed on
May 9, 2006
Sold by
Martins Michael
Bought by
Martins Michael and Demello Raymond D
Current Estimated Value
Purchase Details
Closed on
Sep 5, 2000
Sold by
Harrison Virginia
Bought by
Martins Michael
Create a Home Valuation Report for This Property
The Home Valuation Report is an in-depth analysis detailing your home's value as well as a comparison with similar homes in the area
Home Values in the Area
Average Home Value in this Area
Purchase History
| Date | Buyer | Sale Price | Title Company |
|---|---|---|---|
| Martins Michael | -- | -- | |
| Martins Michael | $40,000 | -- |
Source: Public Records
Mortgage History
| Date | Status | Borrower | Loan Amount |
|---|---|---|---|
| Previous Owner | Martins Michael | $48,000 | |
| Previous Owner | Martins Michael | $55,000 | |
| Previous Owner | Martins Michael | $60,000 | |
| Previous Owner | Martins Michael | $25,000 |
Source: Public Records
Tax History
| Year | Tax Paid | Tax Assessment Tax Assessment Total Assessment is a certain percentage of the fair market value that is determined by local assessors to be the total taxable value of land and additions on the property. | Land | Improvement |
|---|---|---|---|---|
| 2025 | $4,744 | $414,300 | $118,600 | $295,700 |
| 2024 | $4,485 | $390,300 | $116,300 | $274,000 |
| 2023 | $4,664 | $380,100 | $104,800 | $275,300 |
| 2022 | $4,080 | $323,300 | $98,300 | $225,000 |
| 2021 | $4,002 | $289,400 | $93,900 | $195,500 |
| 2020 | $3,815 | $264,000 | $89,600 | $174,400 |
| 2019 | $3,816 | $261,700 | $93,600 | $168,100 |
| 2018 | $3,724 | $254,700 | $92,100 | $162,600 |
| 2017 | $3,529 | $252,100 | $92,100 | $160,000 |
| 2016 | $3,386 | $248,400 | $97,000 | $151,400 |
| 2015 | $3,252 | $248,600 | $97,000 | $151,600 |
| 2014 | $3,127 | $248,600 | $97,000 | $151,600 |
Source: Public Records
Map
Nearby Homes
- 771 Rock St
- 267 Lincoln Ave
- 889 High St
- 909 High St Unit 1
- 72 Belmont St
- 11 Dyer St
- 575 N Main St
- 503 Highland Ave
- 499 Maple St
- 327 Brownell St
- 450 Rock St Unit 1
- 499 Hanover St
- 33-35 Malvey St
- 750 Davol St Unit 321
- 750 Davol St Unit 219
- 750 Davol St Unit 616
- 750 Davol St Unit 214
- 360 High St
- 118 Maple St
- 339 Danforth St Unit 6
- 783 Rock St
- 811 Rock St
- 784 High St
- 221 Lincoln Ave
- 800 Rock St
- 816 Rock St
- 764 High St
- 782 Rock St
- 753 Rock St
- 192 Lincoln Ave
- 754 High St Unit 2
- 754 High St
- 754 High St Unit 3
- 754 High St Unit 2e
- 147 Lincoln Ave
- 208 Lincoln Ave
- 764 Rock St
- 764 Rock St Unit 2
- 764 Rock St Unit 2A
- 764 Rock St Unit ROCK STREET 2NORTH
Your Personal Tour Guide
Ask me questions while you tour the home.