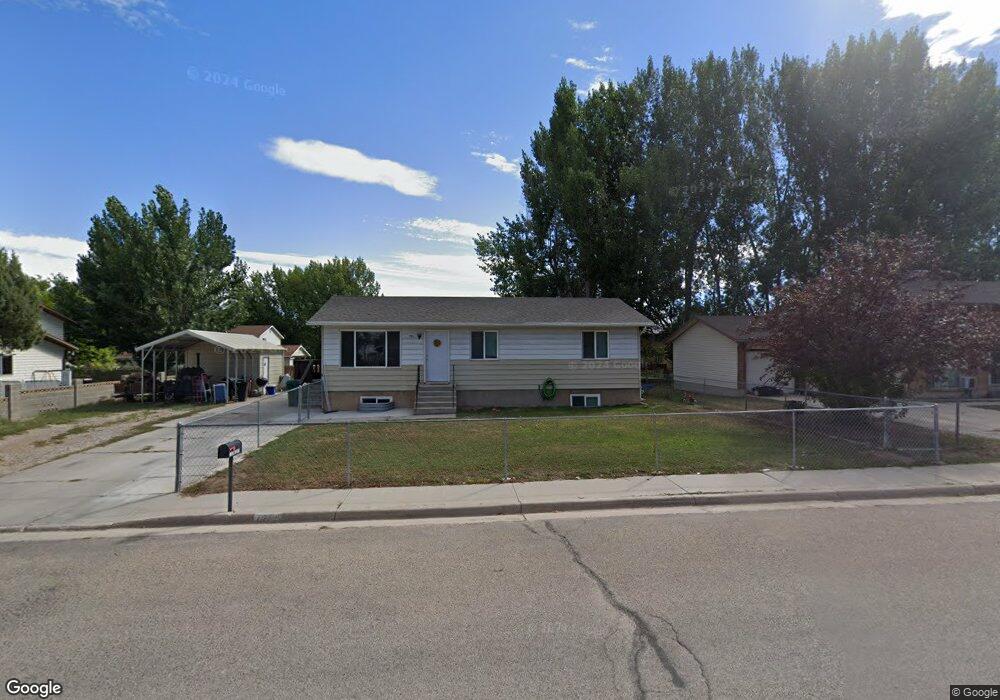
795 W 350 S Vernal, UT 84078
Estimated Value: $293,000 - $333,000
3
Beds
1
Bath
2,016
Sq Ft
$156/Sq Ft
Est. Value
About This Home
This home is located at 795 W 350 S, Vernal, UT 84078 and is currently estimated at $314,962, approximately $156 per square foot. 795 W 350 S is a home located in Uintah County with nearby schools including Discovery School, Vernal Middle School, and Uintah Middle School.
Ownership History
Date
Name
Owned For
Owner Type
Purchase Details
Closed on
Mar 21, 2012
Sold by
Passey Samuel
Bought by
Passey Samuel and Passey Samantha
Current Estimated Value
Home Financials for this Owner
Home Financials are based on the most recent Mortgage that was taken out on this home.
Original Mortgage
$165,300
Outstanding Balance
$116,379
Interest Rate
4.4%
Mortgage Type
FHA
Estimated Equity
$198,583
Purchase Details
Closed on
Aug 13, 2007
Sold by
Passey Samuel
Bought by
Passey Samuel and Passey Samantha
Home Financials for this Owner
Home Financials are based on the most recent Mortgage that was taken out on this home.
Original Mortgage
$173,280
Interest Rate
6.66%
Mortgage Type
FHA
Purchase Details
Closed on
Aug 3, 2007
Sold by
Meier Bryan P and Meier Cheryl A
Bought by
Passey Samuel
Home Financials for this Owner
Home Financials are based on the most recent Mortgage that was taken out on this home.
Original Mortgage
$173,280
Interest Rate
6.66%
Mortgage Type
FHA
Create a Home Valuation Report for This Property
The Home Valuation Report is an in-depth analysis detailing your home's value as well as a comparison with similar homes in the area
Home Values in the Area
Average Home Value in this Area
Purchase History
| Date | Buyer | Sale Price | Title Company |
|---|---|---|---|
| Passey Samuel | -- | None Available | |
| Passey Samuel | -- | -- | |
| Passey Samuel | -- | -- |
Source: Public Records
Mortgage History
| Date | Status | Borrower | Loan Amount |
|---|---|---|---|
| Open | Passey Samuel | $165,300 | |
| Closed | Passey Samuel | $173,280 |
Source: Public Records
Tax History Compared to Growth
Tax History
| Year | Tax Paid | Tax Assessment Tax Assessment Total Assessment is a certain percentage of the fair market value that is determined by local assessors to be the total taxable value of land and additions on the property. | Land | Improvement |
|---|---|---|---|---|
| 2024 | $1,181 | $134,115 | $18,655 | $115,460 |
| 2023 | $1,181 | $113,486 | $18,033 | $95,453 |
| 2022 | $1,020 | $94,396 | $18,033 | $76,363 |
| 2021 | $1,048 | $44,064 | $9,918 | $34,146 |
| 2020 | $1,004 | $78,899 | $18,033 | $60,866 |
| 2019 | $907 | $70,362 | $19,250 | $51,112 |
| 2018 | $877 | $67,928 | $19,250 | $48,678 |
| 2017 | $9 | $70,678 | $22,000 | $48,678 |
| 2016 | $911 | $77,760 | $22,000 | $55,760 |
| 2015 | $873 | $80,694 | $22,000 | $58,694 |
| 2014 | $832 | $77,899 | $22,000 | $55,899 |
| 2013 | $850 | $77,899 | $22,000 | $55,899 |
Source: Public Records
Map
Nearby Homes