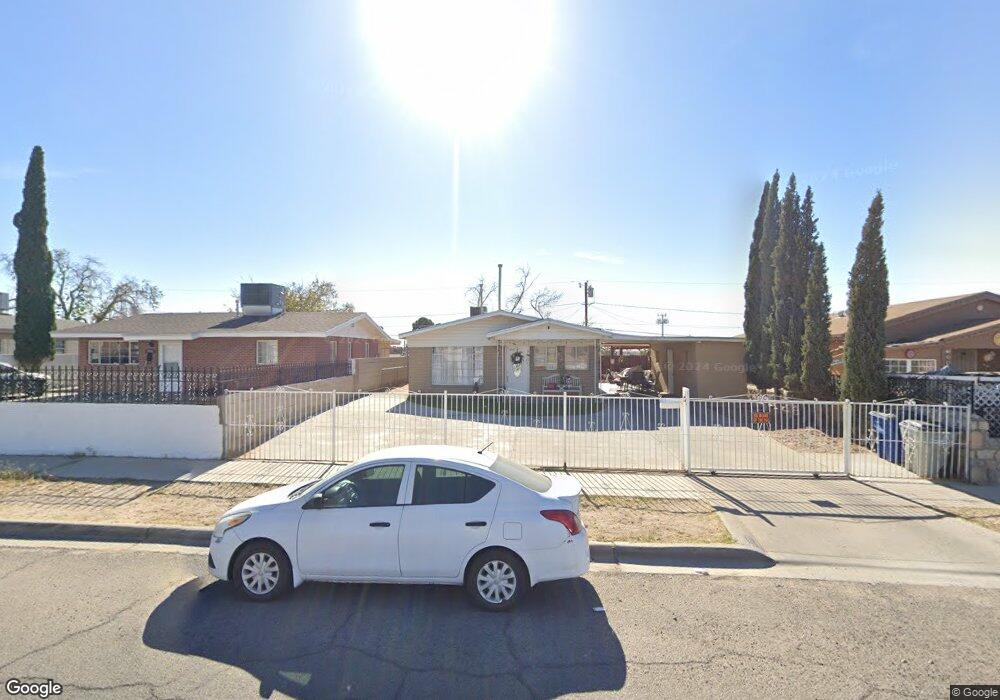
7950 Monterrey Dr El Paso, TX 79915
Sageland NeighborhoodEstimated Value: $126,000 - $153,708
3
Beds
1
Bath
975
Sq Ft
$137/Sq Ft
Est. Value
About This Home
This home is located at 7950 Monterrey Dr, El Paso, TX 79915 and is currently estimated at $133,927, approximately $137 per square foot. 7950 Monterrey Dr is a home located in El Paso County with nearby schools including Sageland Elementary School, Bel Air Middle, and Bel Air High School.
Ownership History
Date
Name
Owned For
Owner Type
Purchase Details
Closed on
Jul 15, 2011
Sold by
Esper Ramsey
Bought by
Renteria Nancy
Current Estimated Value
Home Financials for this Owner
Home Financials are based on the most recent Mortgage that was taken out on this home.
Original Mortgage
$77,484
Outstanding Balance
$30,561
Interest Rate
4.75%
Mortgage Type
FHA
Estimated Equity
$103,366
Purchase Details
Closed on
Feb 9, 2011
Sold by
Secretary Of Veterans Affairs
Bought by
Esper Ramsey M
Purchase Details
Closed on
Sep 13, 2010
Sold by
Munoz Oscar
Bought by
Bac Home Loans Servicing Lp
Purchase Details
Closed on
Sep 7, 2010
Sold by
Bac Home Loans Servicing Lp
Bought by
Secretary Of Veterans Affairs
Purchase Details
Closed on
Jun 9, 2005
Sold by
Alvarado Esther E
Bought by
Munoz Oscar
Home Financials for this Owner
Home Financials are based on the most recent Mortgage that was taken out on this home.
Original Mortgage
$63,333
Interest Rate
5.78%
Mortgage Type
VA
Create a Home Valuation Report for This Property
The Home Valuation Report is an in-depth analysis detailing your home's value as well as a comparison with similar homes in the area
Home Values in the Area
Average Home Value in this Area
Purchase History
| Date | Buyer | Sale Price | Title Company |
|---|---|---|---|
| Renteria Nancy | -- | None Available | |
| Esper Ramsey M | -- | None Available | |
| Bac Home Loans Servicing Lp | $61,239 | None Available | |
| Secretary Of Veterans Affairs | -- | None Available | |
| Munoz Oscar | -- | -- |
Source: Public Records
Mortgage History
| Date | Status | Borrower | Loan Amount |
|---|---|---|---|
| Open | Renteria Nancy | $77,484 | |
| Previous Owner | Munoz Oscar | $63,333 |
Source: Public Records
Tax History Compared to Growth
Tax History
| Year | Tax Paid | Tax Assessment Tax Assessment Total Assessment is a certain percentage of the fair market value that is determined by local assessors to be the total taxable value of land and additions on the property. | Land | Improvement |
|---|---|---|---|---|
| 2025 | $1,557 | $117,345 | -- | -- |
| 2024 | $1,557 | $106,677 | -- | -- |
| 2023 | $1,516 | $96,979 | $0 | $0 |
| 2022 | $2,738 | $88,163 | $0 | $0 |
| 2021 | $2,605 | $80,148 | $14,112 | $66,036 |
| 2020 | $2,403 | $76,094 | $9,996 | $66,098 |
| 2018 | $2,348 | $75,500 | $9,996 | $65,504 |
| 2017 | $2,162 | $70,725 | $9,996 | $60,729 |
| 2016 | $2,162 | $70,725 | $9,996 | $60,729 |
| 2015 | $1,589 | $70,725 | $9,996 | $60,729 |
| 2014 | $1,589 | $71,471 | $9,996 | $61,475 |
Source: Public Records
Map
Nearby Homes
- 7937 San Paulo Dr
- 7928 Hermosillo Dr
- 8004 Gilbert Dr
- 7975 Esther Rd
- 812 Santa Barbara Dr
- 7800 Hermosillo Dr
- 740 Draco Place
- 7922 Parral Dr
- 844 Santa Barbara Dr
- 1121 Stanley St
- 7921 Lirio Rd
- 7832 Ranchland Dr
- 537 Emerson St
- 7718 Parral Dr
- 7909 La Jolla Dr
- 7713 Matamoros Dr
- 7655 Hacienda Ave
- 525 Lafayette Dr
- 7761 Maverick Ave
- 1004 Atwood Dr
- 7952 Monterrey Dr
- 7948 Monterrey Dr
- 7949 San Paulo Dr
- 7946 Monterrey Dr
- 7954 Monterrey Dr
- 7947 San Paulo Dr
- 7951 San Paulo Dr
- 7945 San Paulo Dr
- 7953 San Paulo Dr
- 7944 Monterrey Dr
- 7943 San Paulo Dr
- 7949 Monterrey Dr
- 7956 Monterrey Dr
- 7951 Monterrey Dr
- 7947 Monterrey Dr
- 7953 Monterrey Dr
- 7955 San Paulo Dr
- 7941 San Paulo Dr
- 7945 Monterrey Dr
- 7955 Monterrey Dr