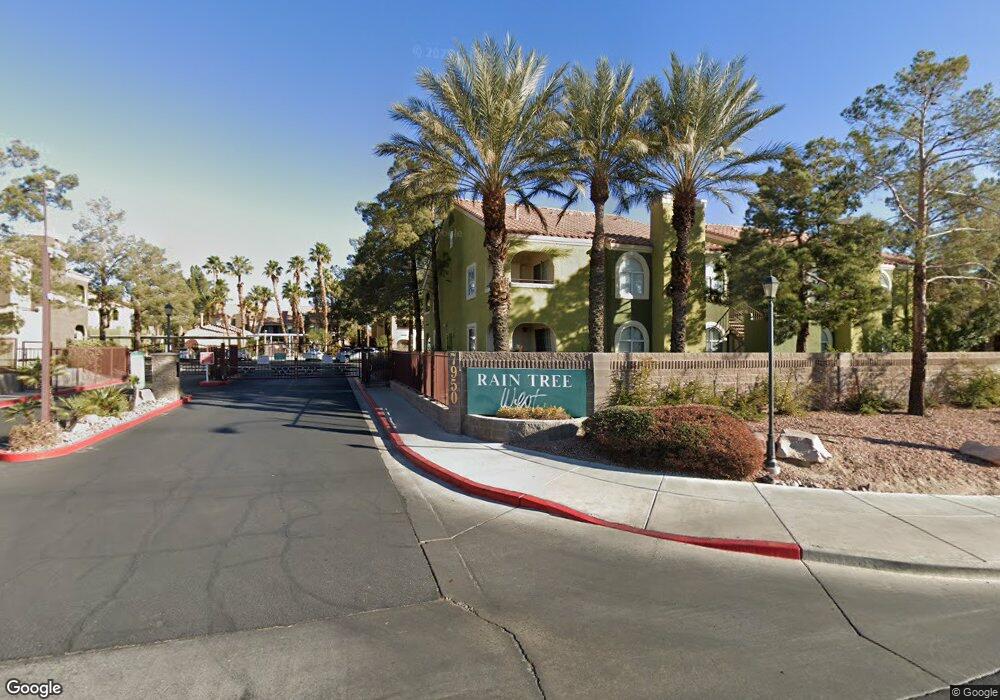
7950 W Flamingo Rd Unit 2116 Las Vegas, NV 89147
Estimated Value: $224,000 - $262,000
2
Beds
2
Baths
1,023
Sq Ft
$240/Sq Ft
Est. Value
About This Home
This home is located at 7950 W Flamingo Rd Unit 2116, Las Vegas, NV 89147 and is currently estimated at $245,660, approximately $240 per square foot. 7950 W Flamingo Rd Unit 2116 is a home located in Clark County with nearby schools including Roger M Bryan Elementary School, Clifford J Lawrence Junior High School, and Spring Valley High School.
Ownership History
Date
Name
Owned For
Owner Type
Purchase Details
Closed on
Jul 10, 2009
Sold by
Federal Home Loan Mortgage Corporation
Bought by
Laurie David B
Current Estimated Value
Purchase Details
Closed on
Feb 13, 2009
Sold by
Dagher Jack A and Dagher Dolla
Bought by
Federal Home Loan Mortgage Corporation
Purchase Details
Closed on
Jun 28, 2004
Sold by
Cino Joseph Michael
Bought by
Dagher Jack A and Dagher Dolla
Home Financials for this Owner
Home Financials are based on the most recent Mortgage that was taken out on this home.
Original Mortgage
$122,250
Interest Rate
6.27%
Mortgage Type
Stand Alone First
Create a Home Valuation Report for This Property
The Home Valuation Report is an in-depth analysis detailing your home's value as well as a comparison with similar homes in the area
Home Values in the Area
Average Home Value in this Area
Purchase History
| Date | Buyer | Sale Price | Title Company |
|---|---|---|---|
| Laurie David B | $65,900 | Fidelity National Title Ti | |
| Federal Home Loan Mortgage Corporation | $88,123 | Cr Title Services Inc | |
| Dagher Jack A | $166,500 | Old Republic Title Co Of N |
Source: Public Records
Mortgage History
| Date | Status | Borrower | Loan Amount |
|---|---|---|---|
| Previous Owner | Dagher Jack A | $122,250 |
Source: Public Records
Tax History Compared to Growth
Tax History
| Year | Tax Paid | Tax Assessment Tax Assessment Total Assessment is a certain percentage of the fair market value that is determined by local assessors to be the total taxable value of land and additions on the property. | Land | Improvement |
|---|---|---|---|---|
| 2025 | $792 | $46,300 | $21,700 | $24,600 |
| 2024 | $770 | $46,300 | $21,700 | $24,600 |
| 2023 | $770 | $48,042 | $25,200 | $22,842 |
| 2022 | $747 | $39,386 | $18,200 | $21,186 |
| 2021 | $726 | $38,114 | $17,500 | $20,614 |
| 2020 | $702 | $37,688 | $17,150 | $20,538 |
| 2019 | $681 | $35,500 | $15,050 | $20,450 |
| 2018 | $661 | $27,995 | $8,050 | $19,945 |
| 2017 | $796 | $27,125 | $6,650 | $20,475 |
| 2016 | $628 | $26,293 | $5,600 | $20,693 |
| 2015 | $625 | $25,259 | $4,550 | $20,709 |
| 2014 | $607 | $20,073 | $5,250 | $14,823 |
Source: Public Records
Map
Nearby Homes
- 7950 W Flamingo Rd Unit 2179
- 7950 W Flamingo Rd Unit 1085
- 7950 W Flamingo Rd Unit 1041
- 7950 W Flamingo Rd Unit 1069
- 7950 W Flamingo Rd Unit 1039
- 7950 W Flamingo Rd Unit 1169
- 7950 W Flamingo Rd Unit 1077
- 7950 W Flamingo Rd Unit 2019
- 7985 Trea Ave
- 7885 W Flamingo Rd Unit 2012
- 7885 W Flamingo Rd Unit 1061
- 7885 W Flamingo Rd Unit 1113
- 7885 W Flamingo Rd Unit 1115
- 7885 W Flamingo Rd Unit 1016
- 7885 W Flamingo Rd Unit 1050
- 7885 W Flamingo Rd Unit 2153
- 7885 W Flamingo Rd Unit 2005
- 7885 W Flamingo Rd Unit 1127
- 7885 W Flamingo Rd Unit 2129
- 7885 W Flamingo Rd Unit 1161
- 7950 W Flamingo Rd Unit 2106
- 7950 W Flamingo Rd Unit 117
- 7950 W Flamingo Rd Unit 2011
- 7950 W Flamingo Rd Unit 1095
- 7950 W Flamingo Rd Unit 2038
- 7950 W Flamingo Rd Unit 2031
- 7950 W Flamingo Rd Unit 1086
- 7950 W Flamingo Rd Unit 1155
- 7950 W Flamingo Rd Unit 2131
- 7950 W Flamingo Rd Unit 2025
- 7950 W Flamingo Rd Unit 2013
- 7950 W Flamingo Rd Unit 1045
- 7950 W Flamingo Rd Unit 1188
- 7950 W Flamingo Rd Unit 2048
- 7950 W Flamingo Rd Unit 1176
- 7950 W Flamingo Rd Unit 1068
- 7950 W Flamingo Rd Unit 2067
- 7950 W Flamingo Rd Unit 2043
- 7950 W Flamingo Rd Unit 1071
- 7950 W Flamingo Rd Unit 2085