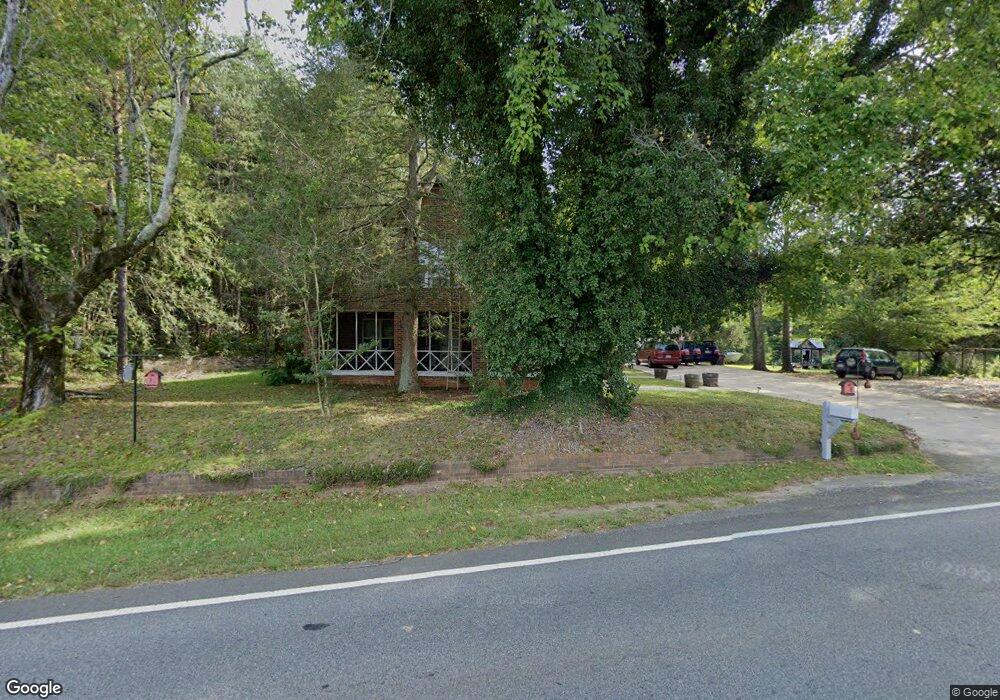
7951 S Chestatee Dahlonega, GA 30533
Estimated Value: $190,000 - $300,000
--
Bed
2
Baths
2,189
Sq Ft
$114/Sq Ft
Est. Value
About This Home
This home is located at 7951 S Chestatee, Dahlonega, GA 30533 and is currently estimated at $249,667, approximately $114 per square foot. 7951 S Chestatee is a home located in Lumpkin County with nearby schools including Lumpkin County High School.
Ownership History
Date
Name
Owned For
Owner Type
Purchase Details
Closed on
Jan 7, 2025
Sold by
Parks Family Properties Lllp
Bought by
White Henley Tonya
Current Estimated Value
Purchase Details
Closed on
Oct 31, 2024
Sold by
Parks Charles Steven
Bought by
Parks Family Properties Lllp
Purchase Details
Closed on
Jun 20, 2024
Sold by
Parks Charles Edwin Trust
Bought by
Parks Charles Steven and Parks James Odum
Home Financials for this Owner
Home Financials are based on the most recent Mortgage that was taken out on this home.
Original Mortgage
$1,784,000
Interest Rate
6.94%
Mortgage Type
New Conventional
Purchase Details
Closed on
Mar 30, 2012
Sold by
Board Of Trustees St Paul Methodist
Bought by
Parks Family Partnership Lllp
Purchase Details
Closed on
Jan 3, 2012
Sold by
Parks James Odum
Bought by
Charles Parks Tuw Fbo
Purchase Details
Closed on
Jan 5, 2001
Bought by
Parks J O Mrs
Purchase Details
Closed on
Dec 2, 1994
Sold by
Parks J O Mrs
Bought by
Parks Charles E
Create a Home Valuation Report for This Property
The Home Valuation Report is an in-depth analysis detailing your home's value as well as a comparison with similar homes in the area
Home Values in the Area
Average Home Value in this Area
Purchase History
| Date | Buyer | Sale Price | Title Company |
|---|---|---|---|
| White Henley Tonya | -- | -- | |
| Parks Family Properties Lllp | $180,000 | -- | |
| Parks Charles Steven | $180,000 | -- | |
| Parks Charles Steven | -- | -- | |
| Parks Charles Edwin Trust | -- | -- | |
| Sw Dahlonega Llc | -- | -- | |
| Sw Dahlonega Llc | -- | -- | |
| Sw Dahlonega Llc | $300,000 | -- | |
| Sw Dahlonega Llc | -- | -- | |
| Parks Family Partnership Lllp | -- | -- | |
| Charles Parks Tuw Fbo | -- | -- | |
| Parks J O Mrs | -- | -- | |
| Parks Charles E | -- | -- |
Source: Public Records
Mortgage History
| Date | Status | Borrower | Loan Amount |
|---|---|---|---|
| Previous Owner | Sw Dahlonega Llc | $1,784,000 |
Source: Public Records
Tax History Compared to Growth
Tax History
| Year | Tax Paid | Tax Assessment Tax Assessment Total Assessment is a certain percentage of the fair market value that is determined by local assessors to be the total taxable value of land and additions on the property. | Land | Improvement |
|---|---|---|---|---|
| 2024 | $1,197 | $66,760 | $32,948 | $33,812 |
| 2023 | $1,445 | $61,448 | $29,952 | $31,496 |
| 2022 | $1,442 | $58,242 | $24,963 | $33,279 |
| 2021 | $1,353 | $52,849 | $24,963 | $27,886 |
| 2020 | $1,345 | $51,003 | $23,920 | $27,083 |
| 2019 | $1,358 | $51,003 | $23,920 | $27,083 |
| 2018 | $1,366 | $48,140 | $23,920 | $24,220 |
| 2017 | $1,409 | $48,693 | $23,920 | $24,773 |
| 2016 | $1,361 | $45,527 | $23,920 | $21,607 |
| 2015 | $1,229 | $45,528 | $23,920 | $21,607 |
| 2014 | $1,229 | $46,604 | $23,920 | $22,683 |
| 2013 | -- | $47,142 | $23,920 | $23,221 |
Source: Public Records
Map
Nearby Homes
- 39 E Point Dr
- 6292 Timber Creek Trail
- 459 Gold Ridge Rd
- 391 Pinewood Place
- 75 Melody Ln
- 125 Lake Laurel Dr
- 6278 Rufus Bryant Rd
- 6587 Rufus Bryant Rd
- 162 Stoneridge Dr
- 6266 Yellow Creek Rd
- 433 Elliots Ln
- 6439 S Chestatee
- 5937 Thompson Bridge Rd
- 6038 S Chestatee
- 6592 Rufus Bryant Rd
- 85 Waterloo Dr
- 334 Silas Rd
- 55 Flat Rock Pointe
- 0 Eagle Rest Rd Unit 13519388
- 0 Long Branch Rd Unit 10271720
- 15 Parks Place
- 39 Waycaster Cir
- 44 Parks Place
- 87 Waycaster Cir
- 14 Martins Ford Rd
- 7785 S Chestatee
- 91 Waycaster Cir
- 7800 S Chestatee
- 92 Martins Ford Rd
- 92 Waycaster Cir
- 109 Waycaster Cir
- 160 Parks Place
- 122 Martins Ford Rd
- 154 Pony Lake Rd
- 167 Parks Place
- 7701 S Chestatee
- 125 Waycaster Cir
- 164 Pony Lake Rd
- 103 Martins Ford Rd
- 117 Waycaster Cir