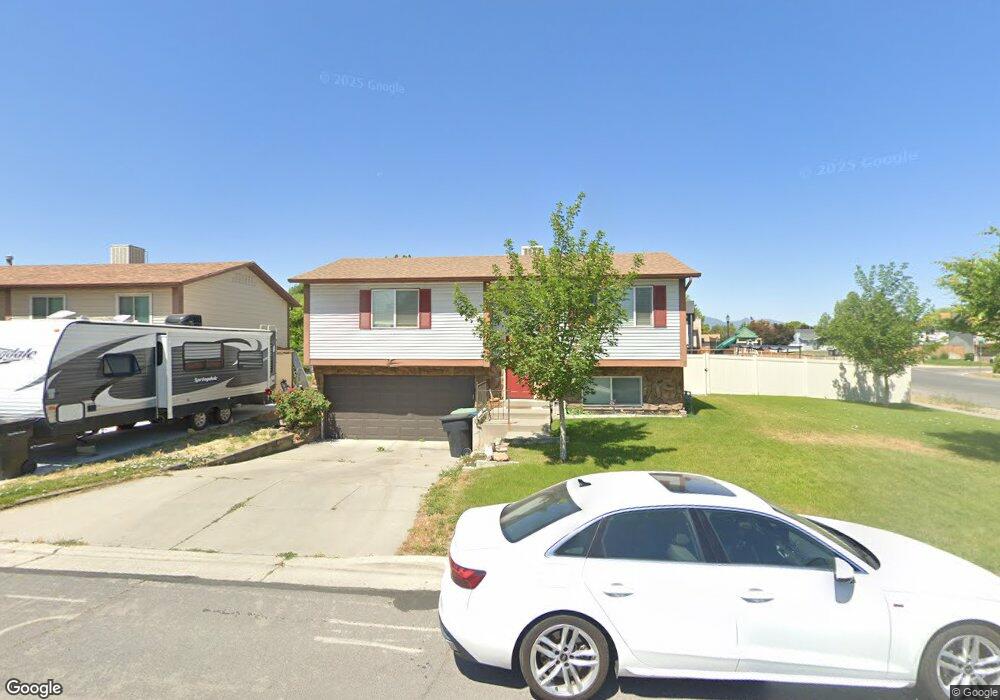
7956 S 2760 W West Jordan, UT 84088
Estimated Value: $402,000 - $430,000
2
Beds
1
Bath
900
Sq Ft
$464/Sq Ft
Est. Value
About This Home
This home is located at 7956 S 2760 W, West Jordan, UT 84088 and is currently estimated at $417,200, approximately $463 per square foot. 7956 S 2760 W is a home located in Salt Lake County with nearby schools including Columbia Elementary School, Joel P. Jensen Middle School, and West Jordan High School.
Ownership History
Date
Name
Owned For
Owner Type
Purchase Details
Closed on
Jun 28, 2017
Sold by
Nelsen Jeffrey M
Bought by
Nelsen Jeffrey Brett and Nelsen Jana T
Current Estimated Value
Home Financials for this Owner
Home Financials are based on the most recent Mortgage that was taken out on this home.
Original Mortgage
$215,000
Outstanding Balance
$179,264
Interest Rate
4.02%
Mortgage Type
New Conventional
Estimated Equity
$237,936
Purchase Details
Closed on
May 3, 1996
Sold by
Nelsen Jeffrey M
Bought by
Nelsen Jeffrey M
Home Financials for this Owner
Home Financials are based on the most recent Mortgage that was taken out on this home.
Original Mortgage
$59,000
Interest Rate
7.68%
Purchase Details
Closed on
Dec 29, 1993
Sold by
Johnson Stacey J Nelsen
Bought by
Nelsen Jeffrey M
Create a Home Valuation Report for This Property
The Home Valuation Report is an in-depth analysis detailing your home's value as well as a comparison with similar homes in the area
Home Values in the Area
Average Home Value in this Area
Purchase History
| Date | Buyer | Sale Price | Title Company |
|---|---|---|---|
| Nelsen Jeffrey Brett | -- | North American Title Llc | |
| Nelsen Jeffrey M | -- | Light Type Company | |
| Nelsen Jeffrey M | -- | -- |
Source: Public Records
Mortgage History
| Date | Status | Borrower | Loan Amount |
|---|---|---|---|
| Open | Nelsen Jeffrey Brett | $215,000 | |
| Closed | Nelsen Jeffrey M | $59,000 |
Source: Public Records
Tax History Compared to Growth
Tax History
| Year | Tax Paid | Tax Assessment Tax Assessment Total Assessment is a certain percentage of the fair market value that is determined by local assessors to be the total taxable value of land and additions on the property. | Land | Improvement |
|---|---|---|---|---|
| 2025 | $2,011 | $400,300 | $109,300 | $291,000 |
| 2024 | $2,011 | $386,900 | $105,700 | $281,200 |
| 2023 | $1,978 | $358,700 | $99,800 | $258,900 |
| 2022 | $2,044 | $364,700 | $97,800 | $266,900 |
| 2021 | $1,757 | $285,300 | $73,400 | $211,900 |
| 2020 | $1,600 | $243,800 | $73,400 | $170,400 |
| 2019 | $1,603 | $239,500 | $73,400 | $166,100 |
| 2018 | $1,352 | $200,400 | $70,700 | $129,700 |
| 2017 | $1,264 | $186,500 | $70,700 | $115,800 |
| 2016 | $1,310 | $181,600 | $70,700 | $110,900 |
| 2015 | $1,217 | $164,500 | $72,100 | $92,400 |
| 2014 | $1,166 | $155,200 | $68,700 | $86,500 |
Source: Public Records
Map
Nearby Homes
- 7942 S 2800 W
- 7993 S 2760 W
- 7968 S 2700 W
- 7987 S 2980 W
- 3066 W Linton Dr
- 7721 Sunset Cir
- 2497 Bueno Vista Dr
- 8026 Laguna Cir
- 7642 S 2700 W
- 3165 W 7720 S
- 7647 S 2500 W
- 2886 W 7550 S
- 2386 W 7680 S
- 8407 Meadow Green Way
- 7604 S Autumn Dr
- 8140 S 2245 W
- 3112 Green Acre Dr
- 3332 Lower Newark Way
- 3354 W 7800 S
- 2573 Jordan Meadows Ln