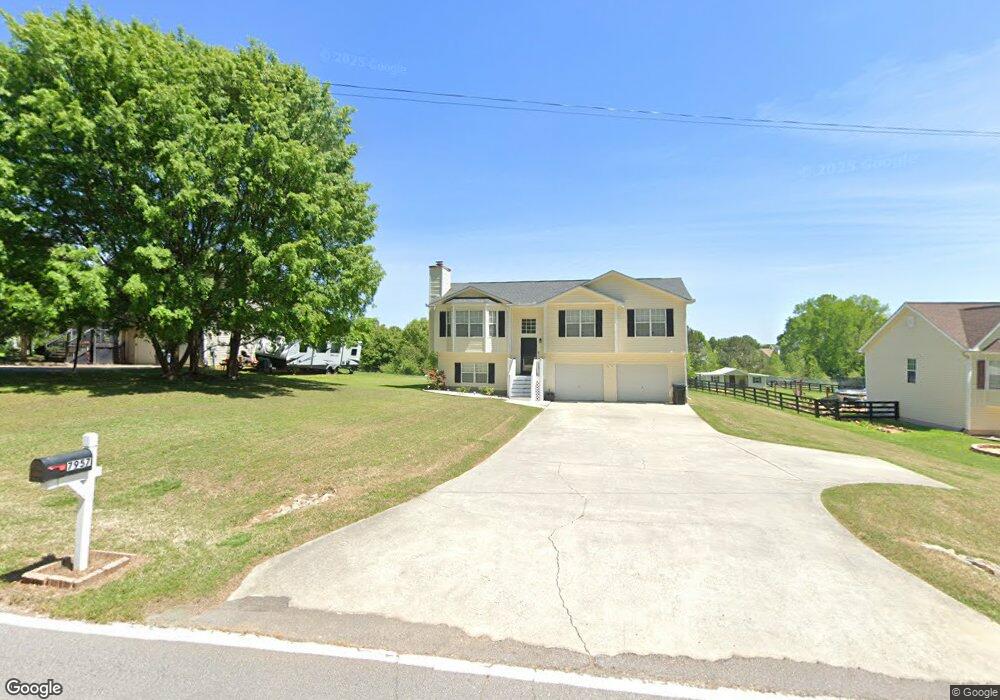
7957 W Carroll Rd Carrollton, GA 30116
Estimated Value: $262,153 - $321,000
3
Beds
2
Baths
1,248
Sq Ft
$237/Sq Ft
Est. Value
About This Home
This home is located at 7957 W Carroll Rd, Carrollton, GA 30116 and is currently estimated at $295,288, approximately $236 per square foot. 7957 W Carroll Rd is a home located in Carroll County with nearby schools including Sand Hill Elementary School, Bay Springs Middle School, and Villa Rica High School.
Ownership History
Date
Name
Owned For
Owner Type
Purchase Details
Closed on
Mar 26, 2018
Sold by
Vaughn Lorri B
Bought by
Vaughn Eddie
Current Estimated Value
Purchase Details
Closed on
Jun 17, 2008
Sold by
Vaughn Eddie
Bought by
Vaughn Lorri B
Purchase Details
Closed on
Sep 25, 2002
Sold by
Vaughn Lorri Blanche
Bought by
Vaughn Eddie and Vaughn Eugene
Purchase Details
Closed on
Apr 10, 2001
Sold by
Vaughn Eddie and Vaughn Eugen
Bought by
Vaughn Lorri Blanche
Purchase Details
Closed on
Jan 22, 2001
Sold by
Holland Estates Llc
Bought by
Family Traditions In
Purchase Details
Closed on
Sep 28, 1999
Bought by
Holland Estates Llc
Create a Home Valuation Report for This Property
The Home Valuation Report is an in-depth analysis detailing your home's value as well as a comparison with similar homes in the area
Home Values in the Area
Average Home Value in this Area
Purchase History
| Date | Buyer | Sale Price | Title Company |
|---|---|---|---|
| Vaughn Eddie | -- | -- | |
| Vaughn Lorri B | -- | -- | |
| Vaughn Eddie | -- | -- | |
| Vaughn Lorri Blanche | -- | -- | |
| Vaughn Eddie | $107,000 | -- | |
| Family Traditions In | $17,000 | -- | |
| Holland Estates Llc | -- | -- |
Source: Public Records
Tax History Compared to Growth
Tax History
| Year | Tax Paid | Tax Assessment Tax Assessment Total Assessment is a certain percentage of the fair market value that is determined by local assessors to be the total taxable value of land and additions on the property. | Land | Improvement |
|---|---|---|---|---|
| 2024 | $1,854 | $107,663 | $9,600 | $98,063 |
| 2023 | $1,854 | $98,779 | $9,600 | $89,179 |
| 2022 | $1,552 | $81,191 | $9,600 | $71,591 |
| 2021 | $1,284 | $64,093 | $9,600 | $54,493 |
| 2020 | $1,168 | $57,610 | $9,600 | $48,010 |
| 2019 | $1,109 | $54,008 | $9,600 | $44,408 |
| 2018 | $868 | $40,048 | $3,120 | $36,928 |
| 2017 | $870 | $40,048 | $3,120 | $36,928 |
| 2016 | $935 | $43,648 | $3,120 | $40,528 |
| 2015 | $742 | $30,528 | $4,000 | $26,528 |
| 2014 | $745 | $30,528 | $4,000 | $26,528 |
Source: Public Records
Map
Nearby Homes
- 7951 W Carroll Rd
- 7963 W Carroll Rd
- 7945 W Carroll Rd
- 7975 W Carroll Rd
- 7939 W Carroll Rd
- 7981 W Carroll Rd
- 7987 W Carroll Rd
- 7933 W Carroll Rd
- 7927 W Carroll Rd
- 7950 W Carroll Rd
- 7993 W Carroll Rd
- 7919 W Carroll Rd
- 0 Clara Bell Way Unit 7177833
- 0 Clara Bell Way
- 145 Holland Rd
- 141 Holland Rd
- 7970 W Carroll Rd
- 7662 W Carroll Rd
- 7934 W Carroll Rd
- 153 Holland Rd