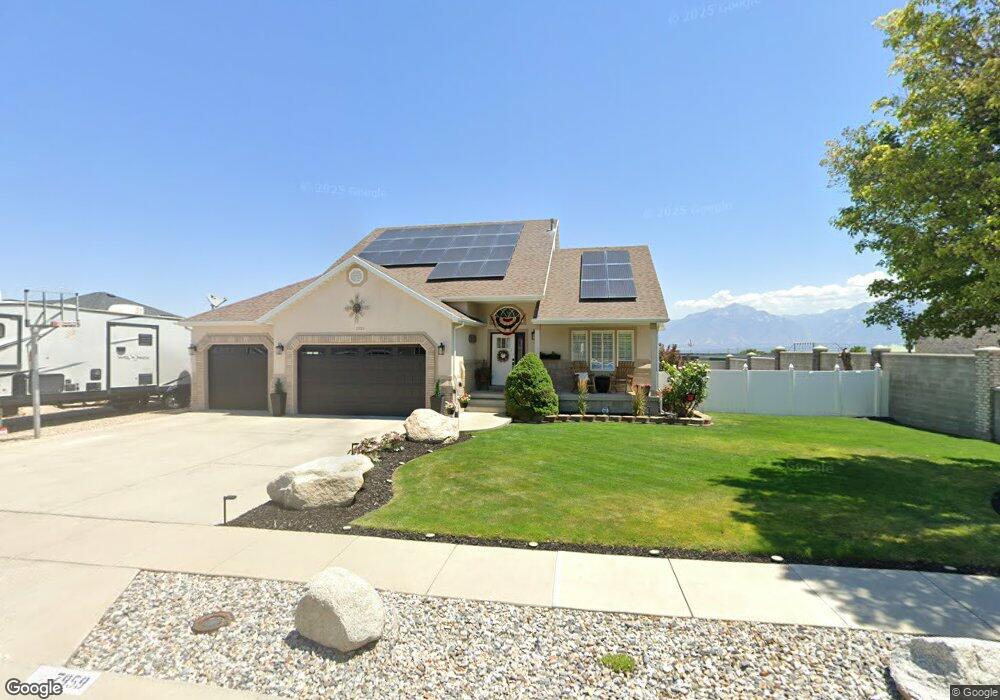
7959 Nebo Dr West Jordan, UT 84088
Cobble Creek NeighborhoodEstimated Value: $624,000 - $702,000
3
Beds
2
Baths
2,184
Sq Ft
$302/Sq Ft
Est. Value
About This Home
This home is located at 7959 Nebo Dr, West Jordan, UT 84088 and is currently estimated at $659,960, approximately $302 per square foot. 7959 Nebo Dr is a home located in Salt Lake County with nearby schools including Hayden Peak Elementary School, West Hills Middle School, and Copper Hills High School.
Ownership History
Date
Name
Owned For
Owner Type
Purchase Details
Closed on
May 8, 2020
Sold by
Smith Todd A and Smith Kaylyn Y
Bought by
Smith Todd and Smith Kayiyn
Current Estimated Value
Home Financials for this Owner
Home Financials are based on the most recent Mortgage that was taken out on this home.
Original Mortgage
$338,600
Outstanding Balance
$300,047
Interest Rate
3.3%
Mortgage Type
New Conventional
Estimated Equity
$359,913
Purchase Details
Closed on
Sep 16, 1999
Sold by
Oakwood Homes Inc
Bought by
Smith Todd A and Smith Kaylyn Y
Home Financials for this Owner
Home Financials are based on the most recent Mortgage that was taken out on this home.
Original Mortgage
$185,900
Interest Rate
7.89%
Purchase Details
Closed on
Mar 15, 1999
Sold by
Kfp Corp
Bought by
Oakwood Homes Inc
Home Financials for this Owner
Home Financials are based on the most recent Mortgage that was taken out on this home.
Original Mortgage
$152,600
Interest Rate
6.73%
Mortgage Type
Construction
Create a Home Valuation Report for This Property
The Home Valuation Report is an in-depth analysis detailing your home's value as well as a comparison with similar homes in the area
Home Values in the Area
Average Home Value in this Area
Purchase History
| Date | Buyer | Sale Price | Title Company |
|---|---|---|---|
| Smith Todd | -- | Us Title | |
| Smith Todd A | -- | Meridian Title | |
| Oakwood Homes Inc | -- | Meridian Title |
Source: Public Records
Mortgage History
| Date | Status | Borrower | Loan Amount |
|---|---|---|---|
| Open | Smith Todd | $338,600 | |
| Closed | Smith Todd A | $185,900 | |
| Previous Owner | Oakwood Homes Inc | $152,600 |
Source: Public Records
Tax History Compared to Growth
Tax History
| Year | Tax Paid | Tax Assessment Tax Assessment Total Assessment is a certain percentage of the fair market value that is determined by local assessors to be the total taxable value of land and additions on the property. | Land | Improvement |
|---|---|---|---|---|
| 2025 | $3,241 | $627,600 | $178,800 | $448,800 |
| 2024 | $3,241 | $623,500 | $177,000 | $446,500 |
| 2023 | $3,241 | $592,200 | $167,000 | $425,200 |
| 2022 | $3,295 | $587,800 | $163,700 | $424,100 |
| 2021 | $2,801 | $454,900 | $127,200 | $327,700 |
| 2020 | $2,563 | $390,600 | $127,200 | $263,400 |
| 2019 | $2,524 | $377,200 | $120,100 | $257,100 |
| 2018 | $2,394 | $354,800 | $120,100 | $234,700 |
| 2017 | $2,418 | $356,800 | $120,100 | $236,700 |
| 2016 | $2,241 | $310,700 | $120,100 | $190,600 |
| 2015 | $2,203 | $297,800 | $126,900 | $170,900 |
| 2014 | $2,029 | $270,100 | $116,700 | $153,400 |
Source: Public Records
Map
Nearby Homes
- 7973 S Nebo Dr
- 4678 Emmons Dr
- 8359 Etude Dr
- 7903 Mckenzie Ln
- 7886 Mckenzie Ln
- 7502 S Lace Wood Dr Unit 417
- 7493 S Lace Wood Dr
- 7908 Cold Stone Ln Unit N3
- 7518 Park Village Dr
- 5189 W Dove Creek Ln
- 5183 W Swift Water Way
- 8322 Copper Vista Cir
- 7882 S Dove Creek Ln Unit A6
- 5228 W Ranches Loop Rd
- 3977 W Elwood Way
- 5298 W Icehouse Way
- 4887 W 8620 S
- 8577 Autumn Gold Cir
- 7556 S Opal Mountain Way W Unit 311
- 7569 S Opal Mountain Way W Unit 308