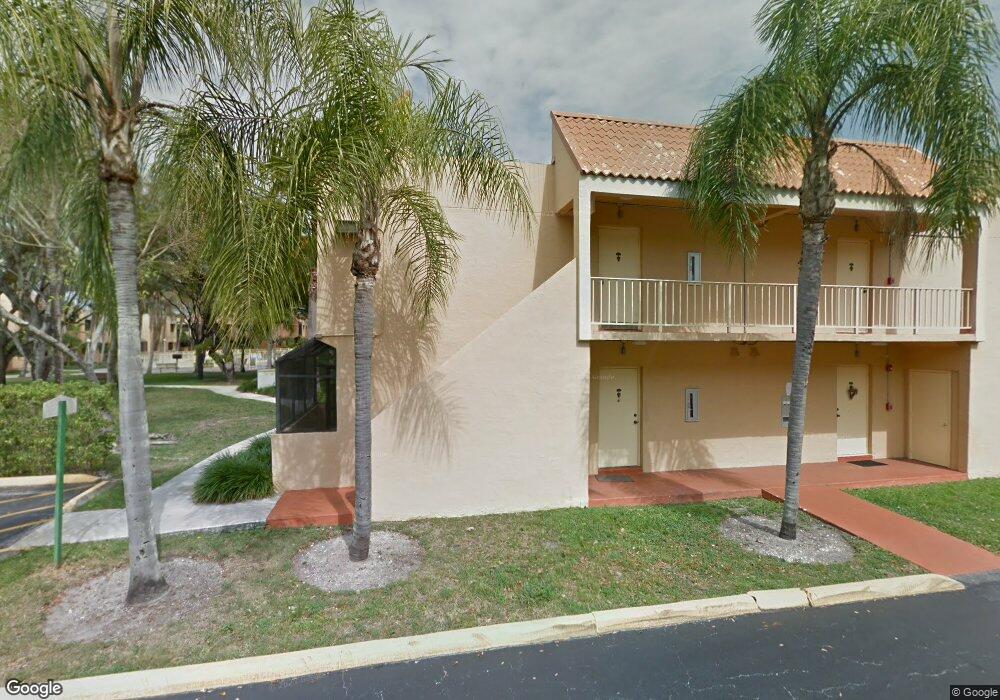
7959 SW 104th St Unit B103 Miami, FL 33156
Downtown Kendall NeighborhoodEstimated Value: $259,000 - $332,000
2
Beds
1
Bath
1,020
Sq Ft
$275/Sq Ft
Est. Value
About This Home
This home is located at 7959 SW 104th St Unit B103, Miami, FL 33156 and is currently estimated at $280,976, approximately $275 per square foot. 7959 SW 104th St Unit B103 is a home located in Miami-Dade County with nearby schools including Kenwood K-8 Center, Glades Middle School, and Miami Killian Senior High School.
Ownership History
Date
Name
Owned For
Owner Type
Purchase Details
Closed on
Mar 1, 2024
Sold by
Nojaba Seyed
Bought by
Safa Enterprises Llc
Current Estimated Value
Purchase Details
Closed on
Jul 19, 2023
Sold by
Leboss Eric M
Bought by
Nojaba Seyed A
Purchase Details
Closed on
Oct 31, 2014
Sold by
Leboss Eric M and Leboss Gail R
Bought by
Leboss Eric M
Purchase Details
Closed on
Jun 1, 2006
Sold by
Blanco Alan M
Bought by
Leboss Eric M and Gary Leboss L
Purchase Details
Closed on
Feb 11, 2005
Sold by
Majo 208 Llc
Bought by
Blanco Alan M
Home Financials for this Owner
Home Financials are based on the most recent Mortgage that was taken out on this home.
Original Mortgage
$161,900
Interest Rate
5.68%
Mortgage Type
Fannie Mae Freddie Mac
Create a Home Valuation Report for This Property
The Home Valuation Report is an in-depth analysis detailing your home's value as well as a comparison with similar homes in the area
Home Values in the Area
Average Home Value in this Area
Purchase History
| Date | Buyer | Sale Price | Title Company |
|---|---|---|---|
| Safa Enterprises Llc | -- | None Listed On Document | |
| Safa Enterprises Llc | -- | None Listed On Document | |
| Nojaba Seyed A | $135,000 | Consumers First Title | |
| Nojaba Seyed A | $135,000 | Consumers First Title | |
| Leboss Eric M | -- | Attorney | |
| Leboss Eric M | $240,000 | Attorney | |
| Blanco Alan M | $179,900 | Hemisphere Title Company |
Source: Public Records
Mortgage History
| Date | Status | Borrower | Loan Amount |
|---|---|---|---|
| Previous Owner | Blanco Alan M | $161,900 |
Source: Public Records
Tax History Compared to Growth
Tax History
| Year | Tax Paid | Tax Assessment Tax Assessment Total Assessment is a certain percentage of the fair market value that is determined by local assessors to be the total taxable value of land and additions on the property. | Land | Improvement |
|---|---|---|---|---|
| 2025 | $3,972 | $217,976 | -- | -- |
| 2024 | $810 | $234,383 | -- | -- |
| 2023 | $810 | $87,684 | $0 | $0 |
| 2022 | $763 | $85,131 | $0 | $0 |
| 2021 | $750 | $82,652 | $0 | $0 |
| 2020 | $735 | $81,511 | $0 | $0 |
| 2019 | $704 | $79,679 | $0 | $0 |
| 2018 | $655 | $78,194 | $0 | $0 |
| 2017 | $640 | $76,586 | $0 | $0 |
| 2016 | $631 | $75,011 | $0 | $0 |
| 2015 | $643 | $74,490 | $0 | $0 |
| 2014 | -- | $73,899 | $0 | $0 |
Source: Public Records
Map
Nearby Homes
- 7955 SW 104th St Unit 203-D
- 7963 SW 104th St Unit 210A
- 7951 SW 104th St Unit 210-D
- 7953 SW 104th St Unit 208-D
- 7923 SW 104th St Unit 114F
- 7919 SW 104th St Unit 105-F
- 7925 SW 104th St Unit 203-E
- 8005 SW 106th St
- 7872 SW 102nd Ln
- 7870 SW 102nd Ln
- 7877 SW 102nd Ln
- 7820 SW 102nd Ln
- 10194 SW 77th Ct
- 10170 SW 77th Ct
- 10142 SW 77th Ct
- 10102 SW 77th Ct
- 10504 SW 77th Ct
- 8285 SW 104th St
- 10004 SW 77th Ct
- 7945 SW 99th St
- 7959 SW 104th St Unit 105-B
- 7959 SW 104th St Unit 205-B
- 7959 SW 104th St Unit 106-B
- 7959 SW 104th St Unit B205
- 7959 SW 104th St Unit B206
- 7959 SW 104th St Unit B105
- 7959 SW 104th St Unit B104
- 7959 SW 104th St Unit B106
- 7959 SW 104th St Unit B204
- 7959 SW 104th St Unit B203
- 7959 SW 104th St Unit 103-B
- 7945 SW 104th St Unit 108-C
- 7945 SW 104th St Unit 106-C
- 7945 SW 104th St Unit 205-C
- 7945 SW 104th St Unit 207-C
- 7945 SW 104th St Unit C205
- 7945 SW 104th St Unit C207