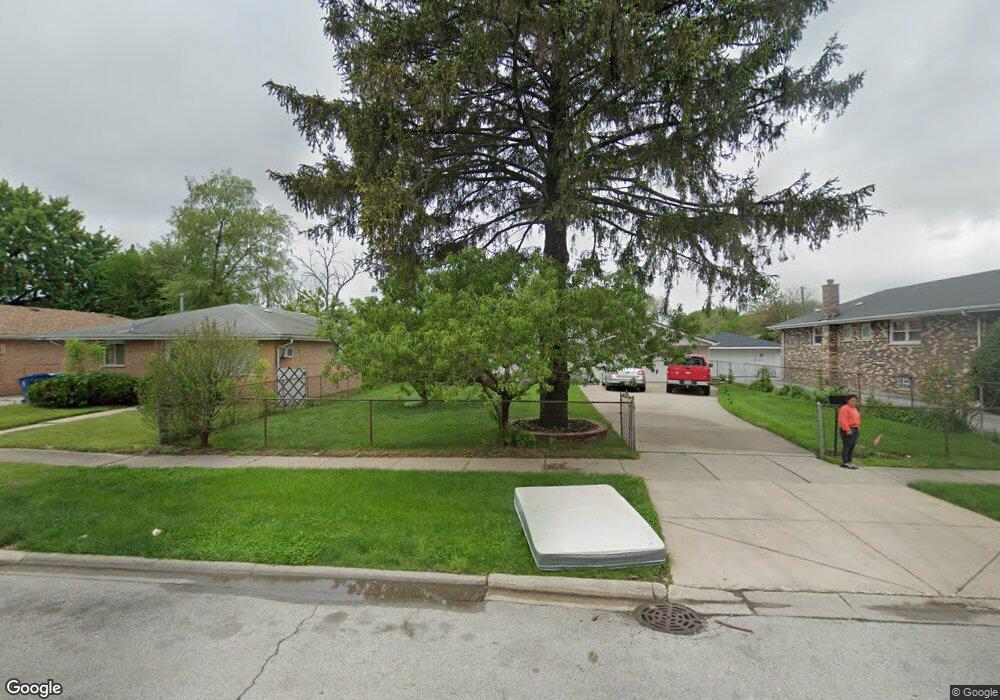
796 Mackinaw Ave Calumet City, IL 60409
Estimated Value: $180,390 - $218,000
3
Beds
2
Baths
1,606
Sq Ft
$119/Sq Ft
Est. Value
About This Home
This home is located at 796 Mackinaw Ave, Calumet City, IL 60409 and is currently estimated at $191,848, approximately $119 per square foot. 796 Mackinaw Ave is a home located in Cook County with nearby schools including Lincoln Elementary School, Thornton Fractional North High School, and Hammond Academy Of Science & Tech.
Ownership History
Date
Name
Owned For
Owner Type
Purchase Details
Closed on
Mar 2, 2007
Sold by
Manousopoulos Nikolaos and Manousopoulos Dimitrios
Bought by
Sotelo Rufino and Sotelo Isalia
Current Estimated Value
Home Financials for this Owner
Home Financials are based on the most recent Mortgage that was taken out on this home.
Original Mortgage
$96,000
Outstanding Balance
$62,303
Interest Rate
7.62%
Mortgage Type
Purchase Money Mortgage
Estimated Equity
$129,545
Purchase Details
Closed on
Feb 23, 2006
Sold by
Value Construction Co and Manousopoulos Nikolaos
Bought by
Lowery Deandre
Home Financials for this Owner
Home Financials are based on the most recent Mortgage that was taken out on this home.
Original Mortgage
$238,500
Interest Rate
10.3%
Mortgage Type
Fannie Mae Freddie Mac
Purchase Details
Closed on
Apr 28, 2005
Sold by
Mika Stephanie Theresa
Bought by
Manousopoulos Nikolaos and Manousopoulos Dimitrios
Create a Home Valuation Report for This Property
The Home Valuation Report is an in-depth analysis detailing your home's value as well as a comparison with similar homes in the area
Home Values in the Area
Average Home Value in this Area
Purchase History
| Date | Buyer | Sale Price | Title Company |
|---|---|---|---|
| Sotelo Rufino | $120,000 | Pntn | |
| Lowery Deandre | $265,000 | Git | |
| Manousopoulos Nikolaos | $67,000 | Chicago Title Insurance Comp |
Source: Public Records
Mortgage History
| Date | Status | Borrower | Loan Amount |
|---|---|---|---|
| Open | Sotelo Rufino | $96,000 | |
| Previous Owner | Lowery Deandre | $238,500 |
Source: Public Records
Tax History Compared to Growth
Tax History
| Year | Tax Paid | Tax Assessment Tax Assessment Total Assessment is a certain percentage of the fair market value that is determined by local assessors to be the total taxable value of land and additions on the property. | Land | Improvement |
|---|---|---|---|---|
| 2024 | $4,250 | $11,000 | $2,947 | $8,053 |
| 2023 | $3,006 | $11,000 | $2,947 | $8,053 |
| 2022 | $3,006 | $7,574 | $2,579 | $4,995 |
| 2021 | $3,133 | $7,572 | $2,578 | $4,994 |
| 2020 | $3,079 | $7,572 | $2,578 | $4,994 |
| 2019 | $4,351 | $9,447 | $2,394 | $7,053 |
| 2018 | $4,284 | $9,447 | $2,394 | $7,053 |
| 2017 | $4,169 | $9,447 | $2,394 | $7,053 |
| 2016 | $4,251 | $9,071 | $2,210 | $6,861 |
| 2015 | $4,024 | $9,071 | $2,210 | $6,861 |
| 2014 | $4,055 | $9,071 | $2,210 | $6,861 |
| 2013 | $3,374 | $8,586 | $2,210 | $6,376 |
Source: Public Records
Map
Nearby Homes
- 856 Mackinaw Ave
- 863 Mackinaw Ave
- 775 Greenbay Ave
- 531 156th St
- 518 156th Place
- 510 157th St
- 509 Webb St
- 929 Greenbay Ave
- 708 May St
- 719 Greenbay Ave
- 446 Warren St
- 419 157th St
- 505 154th Place
- 502 154th Place
- 658 Mackinaw Ave
- 650 Mackinaw Ave
- 650 Greenbay Ave
- 782 Campbell Ave
- 344 156th Place
- 347 156th St
- 796 Mackinaw Ave
- 797 Buffalo Ave
- 797 Buffalo Ave Unit 2
- 797 Buffalo Ave Unit 1
- 802 Mackinaw Ave
- 808 Mackinaw Ave
- 792 Mackinaw Ave
- 795 Buffalo Ave
- 791 Buffalo Ave
- 790 Mackinaw Ave
- 809 Buffalo Ave
- 789 Buffalo Ave
- 789 Buffalo Ave Unit 1
- 788 Mackinaw Ave
- 787 Buffalo Ave
- 812 Mackinaw Ave
- 811 Buffalo Ave
- 786 Mackinaw Ave
- 783 Buffalo Ave
- 783 Buffalo Ave