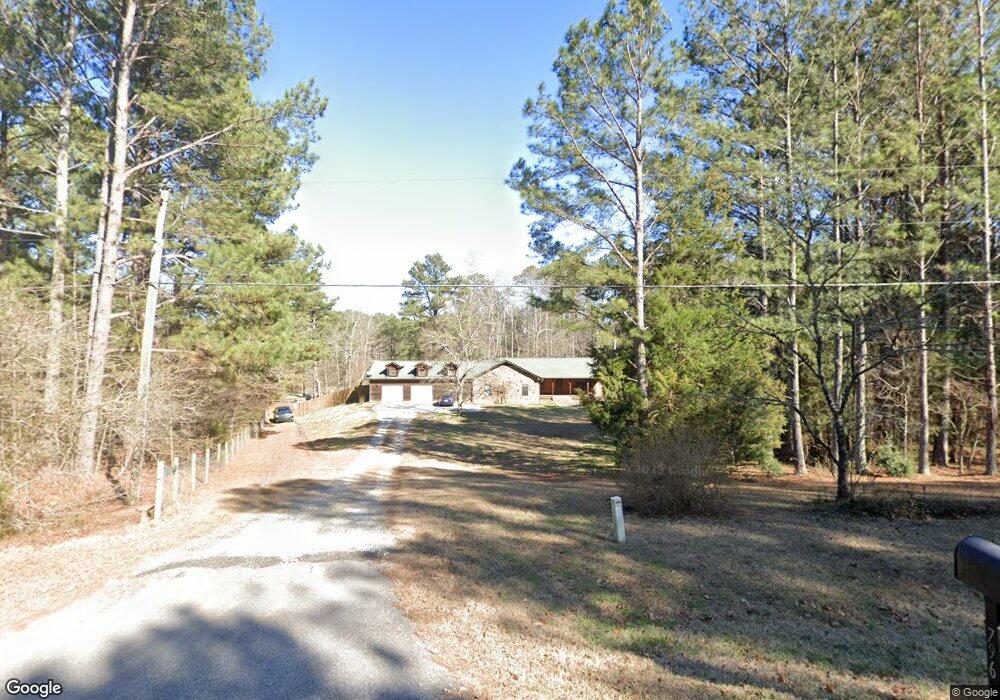
796 Pj East Rd Unit 10 Covington, GA 30014
Estimated Value: $529,442 - $623,000
--
Bed
3
Baths
1,861
Sq Ft
$310/Sq Ft
Est. Value
About This Home
This home is located at 796 Pj East Rd Unit 10, Covington, GA 30014 and is currently estimated at $577,147, approximately $310 per square foot. 796 Pj East Rd Unit 10 is a home with nearby schools including Walnut Grove Elementary School, Youth Middle School, and Walnut Grove High School.
Ownership History
Date
Name
Owned For
Owner Type
Purchase Details
Closed on
Jan 31, 2014
Sold by
Miller Wanda D
Bought by
Kinney Peggy J and Kinney Arus J
Current Estimated Value
Purchase Details
Closed on
Dec 5, 2012
Sold by
Miller David S
Bought by
Miller Wanda D
Purchase Details
Closed on
Nov 2, 2009
Sold by
Miller Wanda
Bought by
Miller David S and Miller Wanda D
Home Financials for this Owner
Home Financials are based on the most recent Mortgage that was taken out on this home.
Original Mortgage
$198,811
Interest Rate
5.01%
Mortgage Type
New Conventional
Purchase Details
Closed on
Jan 26, 2007
Sold by
Miller David
Bought by
Miller Wanda
Home Financials for this Owner
Home Financials are based on the most recent Mortgage that was taken out on this home.
Original Mortgage
$165,000
Interest Rate
6.08%
Mortgage Type
New Conventional
Create a Home Valuation Report for This Property
The Home Valuation Report is an in-depth analysis detailing your home's value as well as a comparison with similar homes in the area
Home Values in the Area
Average Home Value in this Area
Purchase History
| Date | Buyer | Sale Price | Title Company |
|---|---|---|---|
| Kinney Peggy J | $225,000 | -- | |
| Miller Wanda D | -- | -- | |
| Miller David S | -- | -- | |
| Miller Wanda | -- | -- |
Source: Public Records
Mortgage History
| Date | Status | Borrower | Loan Amount |
|---|---|---|---|
| Previous Owner | Miller David S | $198,811 | |
| Previous Owner | Miller Wanda | $165,000 |
Source: Public Records
Tax History Compared to Growth
Tax History
| Year | Tax Paid | Tax Assessment Tax Assessment Total Assessment is a certain percentage of the fair market value that is determined by local assessors to be the total taxable value of land and additions on the property. | Land | Improvement |
|---|---|---|---|---|
| 2024 | $4,067 | $137,948 | $41,320 | $96,628 |
| 2023 | $4,046 | $133,388 | $39,200 | $94,188 |
| 2022 | $3,827 | $121,028 | $35,280 | $85,748 |
| 2021 | $3,336 | $102,388 | $24,520 | $77,868 |
| 2020 | $3,270 | $97,868 | $21,280 | $76,588 |
| 2019 | $3,139 | $93,228 | $18,920 | $74,308 |
| 2018 | $3,118 | $93,228 | $18,920 | $74,308 |
| 2017 | $3,149 | $91,388 | $18,920 | $72,468 |
| 2016 | $2,718 | $80,052 | $13,480 | $66,572 |
| 2015 | $2,406 | $69,732 | $13,480 | $56,252 |
| 2014 | $1,788 | $53,040 | $12,840 | $40,200 |
Source: Public Records
Map
Nearby Homes
- 6212 Waters Edge Dr
- 172 Iroquois Ct
- 815 Spring View Ct
- 410 Iroquois Ct
- 26 ACRES P J Rd E
- 492 Nunnally Farm Rd
- +/- 35 ACRES Youth Jersey Rd
- 35 AC Youth Jersey Rd
- +/- 14 ACRES Youth Jersey Rd
- 173 Youth Jersey Rd
- 14 AC Youth Jersey Rd
- 7 ACRES Youth Jersey Rd
- 7 AC Youth Jersey Rd
- 1285 P J Rd E
- 1275 P J East Rd
- 1297 P J East Rd
- 1269 P J East Rd
- 2485 Amber Hills Dr
- 543 Sterling Water Dr
- 1202 Nunnally Dr
- 796 Pj East Rd
- 796 Pj East Rd
- 796 P J Rd E Unit 10
- 776 Pj East Rd
- 806 P J East Rd
- 806 Pj East Rd
- 806 P J Rd E
- 756 P J Rd E
- 5221 Fieldspring Ln
- 5219 Fieldspring Ln
- 756 Pj East Rd
- 855 Pj East Rd
- 7316 Lake Walton Blvd
- 5220 Fieldspring Ln
- 5217 Fieldspring Ln
- 7314 Lake Walton Blvd
- 7312 Lake Walton Blvd
- 7310 Lake Walton Blvd
- 952 Pj East Rd
- 5218 Fieldspring Ln