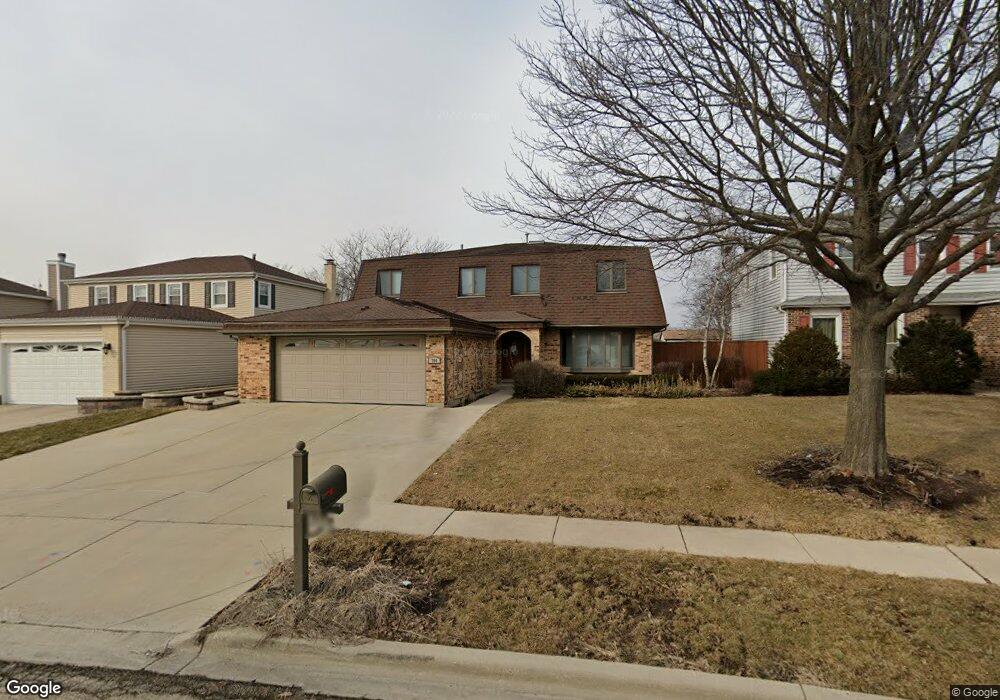
796 Randi Ln Hoffman Estates, IL 60169
South Hoffman Estates NeighborhoodEstimated Value: $390,000 - $569,000
4
Beds
4
Baths
2,112
Sq Ft
$232/Sq Ft
Est. Value
About This Home
This home is located at 796 Randi Ln, Hoffman Estates, IL 60169 and is currently estimated at $490,967, approximately $232 per square foot. 796 Randi Ln is a home located in Cook County with nearby schools including Enders-Salk Elementary School, Helen Keller Junior High School, and Schaumburg High School.
Ownership History
Date
Name
Owned For
Owner Type
Purchase Details
Closed on
Sep 12, 2025
Sold by
Hwdny Llc
Bought by
2025 Azk Irrevocable Trust
Current Estimated Value
Purchase Details
Closed on
Nov 12, 2021
Sold by
Dcr7il Llc
Bought by
Hzudny Llc
Purchase Details
Closed on
Jan 15, 2020
Sold by
Zawilla Edward J
Bought by
Dcr7il Llc
Purchase Details
Closed on
Dec 19, 2019
Sold by
Dcr Mortgage 7 Sub 2 Llc
Bought by
Dcr7il Llc
Purchase Details
Closed on
Dec 2, 2014
Sold by
Zawillla Jill M and Zawilla Edward J
Bought by
Zawilla Edward J
Home Financials for this Owner
Home Financials are based on the most recent Mortgage that was taken out on this home.
Original Mortgage
$700,000
Interest Rate
6%
Mortgage Type
New Conventional
Purchase Details
Closed on
Jul 15, 1996
Sold by
American National Bk & Tr Co Of Chicago
Bought by
Zawilla Edward J and Zawilla Jill M
Create a Home Valuation Report for This Property
The Home Valuation Report is an in-depth analysis detailing your home's value as well as a comparison with similar homes in the area
Home Values in the Area
Average Home Value in this Area
Purchase History
| Date | Buyer | Sale Price | Title Company |
|---|---|---|---|
| 2025 Azk Irrevocable Trust | -- | Chicago Title Insurance Compan | |
| Hzudny Llc | $285,000 | Chicago Title | |
| Dcr7il Llc | -- | None Available | |
| Dcr7il Llc | -- | None Available | |
| Zawilla Edward J | -- | None Available | |
| Zawilla Edward J | -- | -- |
Source: Public Records
Mortgage History
| Date | Status | Borrower | Loan Amount |
|---|---|---|---|
| Previous Owner | Zawilla Edward J | $700,000 |
Source: Public Records
Tax History
| Year | Tax Paid | Tax Assessment Tax Assessment Total Assessment is a certain percentage of the fair market value that is determined by local assessors to be the total taxable value of land and additions on the property. | Land | Improvement |
|---|---|---|---|---|
| 2025 | $10,434 | $44,000 | $7,151 | $36,849 |
| 2024 | $10,434 | $34,000 | $5,959 | $28,041 |
| 2023 | $10,098 | $34,000 | $5,959 | $28,041 |
| 2022 | $10,098 | $34,000 | $5,959 | $28,041 |
| 2021 | $9,344 | $31,220 | $4,171 | $27,049 |
| 2020 | $9,200 | $31,220 | $4,171 | $27,049 |
| 2019 | $9,152 | $34,689 | $4,171 | $30,518 |
| 2018 | $8,355 | $29,058 | $3,575 | $25,483 |
| 2017 | $8,225 | $29,058 | $3,575 | $25,483 |
| 2016 | $7,913 | $29,058 | $3,575 | $25,483 |
| 2015 | $6,389 | $22,516 | $3,128 | $19,388 |
| 2014 | $6,294 | $22,516 | $3,128 | $19,388 |
| 2013 | $6,114 | $22,516 | $3,128 | $19,388 |
Source: Public Records
Map
Nearby Homes
- 712 Scarbrough Cir Unit 126
- 1021 Warwick Cir S
- 705 Ascot Ct
- 658 Claridge Cir Unit 99
- 1220 Dorchester Ln
- 923 Daniels Ct Unit 2
- 426 Argyll Ln
- 424 N Salem Dr
- 670 Lakeview Ln
- 1045 Higgins Quarters Dr Unit 4-101
- 1025 Higgins Quarters Dr Unit 4-109
- 828 Harwich Ln
- 308 Wianno Ln
- 1365 Newcastle Ln
- 630 Bode Rd
- 1335 Blair Ln
- 917 Aimtree Place
- 720 Hill Dr Unit 8303
- 600 Baxter Ln
- 600 Mesa Dr Unit 103
Your Personal Tour Guide
Ask me questions while you tour the home.