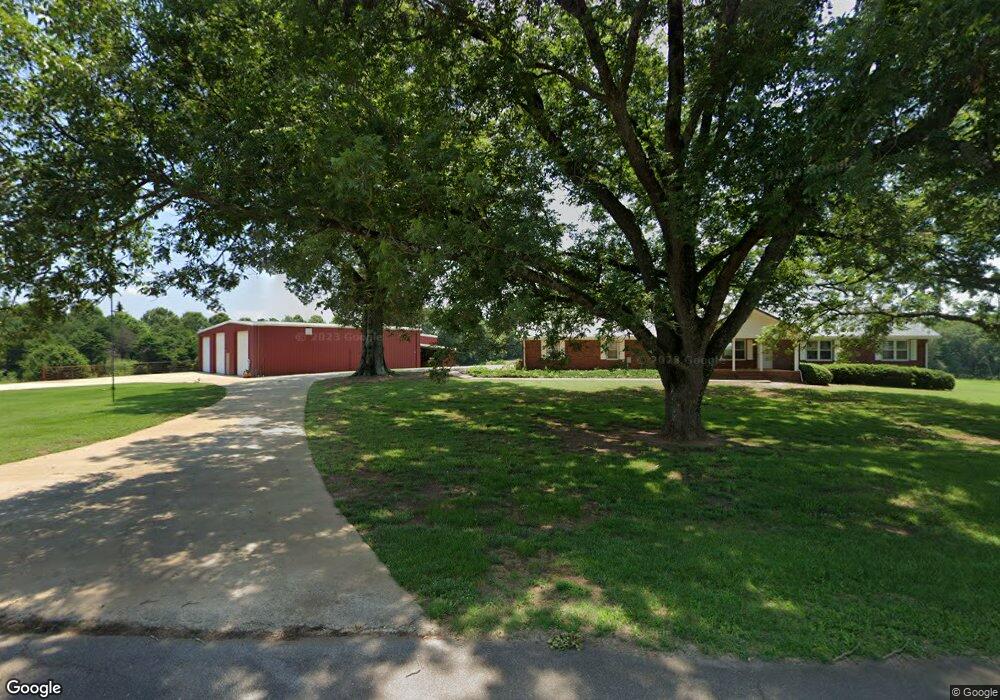
796 Y Z Sailors Rd Jefferson, GA 30549
Estimated Value: $418,000
--
Bed
1
Bath
2,333
Sq Ft
$179/Sq Ft
Est. Value
About This Home
This home is located at 796 Y Z Sailors Rd, Jefferson, GA 30549 and is currently priced at $418,000, approximately $179 per square foot. 796 Y Z Sailors Rd is a home located in Jackson County with nearby schools including Satilla Elementary School, East Jackson Elementary School, and East Jackson Middle School.
Ownership History
Date
Name
Owned For
Owner Type
Purchase Details
Closed on
Oct 1, 2024
Sold by
Peoples Bank & Trust
Bought by
Chanelizabeth Development Llc
Current Estimated Value
Purchase Details
Closed on
Apr 2, 2024
Sold by
Peoples Bank & Trust
Bought by
Chanelizabeth Development Llc
Purchase Details
Closed on
Nov 29, 2023
Sold by
Peoples Bank & Trust
Bought by
Chanelizabeth Development Llc
Purchase Details
Closed on
Nov 28, 2023
Sold by
Chanelizabeth Homes Llc
Bought by
Southern Heritage Home Builders Llc
Purchase Details
Closed on
Jul 24, 2023
Sold by
Chanelizabeth Development Llc
Bought by
Peoples Bank & Trust
Purchase Details
Closed on
May 24, 2023
Sold by
Peoples Bank And Trust
Bought by
Chanelizabeth Development Llc
Purchase Details
Closed on
Jan 6, 2021
Sold by
Gee Sarah Barnett
Bought by
Bbc Investment Grp Llc
Create a Home Valuation Report for This Property
The Home Valuation Report is an in-depth analysis detailing your home's value as well as a comparison with similar homes in the area
Home Values in the Area
Average Home Value in this Area
Purchase History
| Date | Buyer | Sale Price | Title Company |
|---|---|---|---|
| Chanelizabeth Development Llc | -- | -- | |
| Chanelizabeth Development Llc | -- | -- | |
| Chanelizabeth Development Llc | -- | -- | |
| Southern Heritage Home Builders Llc | $225,000 | -- | |
| Peoples Bank & Trust | -- | -- | |
| Chanelizabeth Development Llc | -- | -- | |
| Chanelizabeth Homes Llc | -- | -- | |
| Cornerstone Home Builders Llc | -- | -- | |
| Bbc Investment Grp Llc | $800,000 | -- |
Source: Public Records
Tax History Compared to Growth
Tax History
| Year | Tax Paid | Tax Assessment Tax Assessment Total Assessment is a certain percentage of the fair market value that is determined by local assessors to be the total taxable value of land and additions on the property. | Land | Improvement |
|---|---|---|---|---|
| 2023 | $5,534 | $172,160 | $172,160 | $0 |
| 2022 | $5,953 | $185,204 | $86,080 | $99,124 |
| 2021 | $5,422 | $185,204 | $86,080 | $99,124 |
| 2020 | $3,323 | $173,724 | $86,080 | $87,644 |
| 2019 | $3,358 | $173,724 | $86,080 | $87,644 |
| 2018 | $3,329 | $169,223 | $83,440 | $85,783 |
| 2017 | $3,106 | $146,978 | $66,778 | $80,200 |
| 2016 | $3,110 | $146,978 | $66,778 | $80,200 |
| 2015 | $3,110 | $146,978 | $66,778 | $80,200 |
| 2014 | $2,987 | $142,945 | $66,778 | $76,167 |
| 2013 | -- | $151,292 | $75,125 | $76,167 |
Source: Public Records
Map
Nearby Homes
- 372 Glenside Dr
- 372 Glenside Dr Unit 76
- 486 Glenside Dr
- 179 Merwood Ln
- 179 Merwood Ln Unit 125
- 134 Oakdale Rd
- 134 Oakdale Rd Unit 31
- 166 Montview Dr
- 166 Montview Dr Unit 112
- 184 Montview Dr
- 184 Montview Dr Unit 111
- 150 Oakdale Rd Unit 32
- 150 Oakdale Rd
- 164 Oakdale Rd
- 164 Oakdale Rd Unit 33
- 199 Montview Dr
- 199 Montview Dr Unit 90
- 233 Oakdale Rd
- 233 Oakdale Rd Unit 53
- 174 Oakdale Rd Unit 34
- 796 Y Z Sailors Rd
- 486 Glenside Dr Unit 67
- 226 Merwood Ln
- 500 Glenside Dr
- 510 Glenside Dr Unit 63
- 510 Glenside Dr
- 540 Glenside Dr Unit 61
- 540 Glenside Dr
- 1050 Mauldin Rd
- 875 Mauldin Rd
- 964 Mauldin Rd
- 862 Mauldin Rd
- 71 Mauldin Rd
- 610 Glenside Dr Unit 4
- 610 Glenside Dr
- 626 Glenside Dr Unit 5
- 626 Glenside Dr
- 573 Y Z Sailors Rd
- 690 Y Z Sailors Rd
- 847 Mauldin Rd