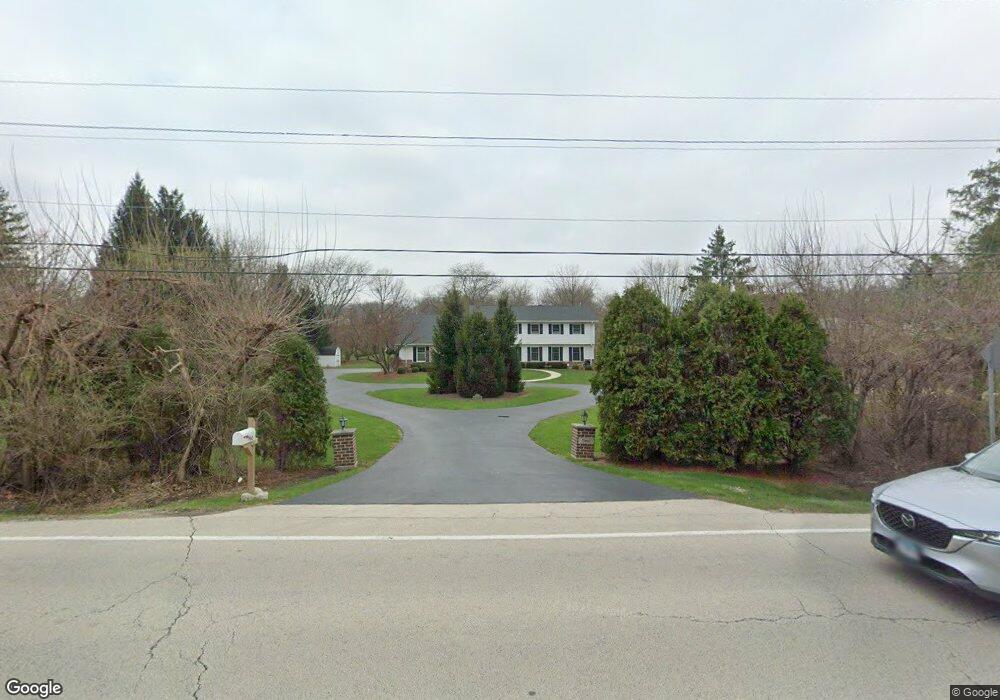
7960 Wolf Rd Burr Ridge, IL 60527
Burr Ridge East NeighborhoodEstimated Value: $1,051,000 - $1,155,000
4
Beds
3
Baths
4,319
Sq Ft
$254/Sq Ft
Est. Value
About This Home
This home is located at 7960 Wolf Rd, Burr Ridge, IL 60527 and is currently estimated at $1,098,073, approximately $254 per square foot. 7960 Wolf Rd is a home located in Cook County with nearby schools including Pleasantdale Elementary School, Pleasantdale Middle School, and Lyons Township High School.
Ownership History
Date
Name
Owned For
Owner Type
Purchase Details
Closed on
Nov 16, 2012
Sold by
Sharma Anil M and Sharma Manju Prakash
Bought by
Sharma Anil M and Sharma Manju Prakash
Current Estimated Value
Purchase Details
Closed on
Dec 4, 2006
Sold by
Sharma Manju Prakash
Bought by
Sharma Manju Prakash M and Anil M & Manju Prakash Sharma Living Tr
Purchase Details
Closed on
Aug 15, 2005
Sold by
Patterson William L and Patterson Mary Beth
Bought by
Sharma Anil and Sharma Manju
Home Financials for this Owner
Home Financials are based on the most recent Mortgage that was taken out on this home.
Original Mortgage
$359,600
Outstanding Balance
$191,686
Interest Rate
5.89%
Mortgage Type
Fannie Mae Freddie Mac
Estimated Equity
$906,387
Purchase Details
Closed on
Mar 5, 1998
Sold by
Duitsman Ronald L and Duitsman Mary L
Bought by
Patterson William L and Patterson Mary Beth
Home Financials for this Owner
Home Financials are based on the most recent Mortgage that was taken out on this home.
Original Mortgage
$350,000
Interest Rate
6.12%
Create a Home Valuation Report for This Property
The Home Valuation Report is an in-depth analysis detailing your home's value as well as a comparison with similar homes in the area
Home Values in the Area
Average Home Value in this Area
Purchase History
| Date | Buyer | Sale Price | Title Company |
|---|---|---|---|
| Sharma Anil M | -- | None Available | |
| Sharma Manju Prakash M | -- | None Available | |
| Sharma Anil | $675,000 | -- | |
| Patterson William L | $450,000 | -- |
Source: Public Records
Mortgage History
| Date | Status | Borrower | Loan Amount |
|---|---|---|---|
| Open | Sharma Anil | $359,600 | |
| Previous Owner | Patterson William L | $350,000 |
Source: Public Records
Tax History Compared to Growth
Tax History
| Year | Tax Paid | Tax Assessment Tax Assessment Total Assessment is a certain percentage of the fair market value that is determined by local assessors to be the total taxable value of land and additions on the property. | Land | Improvement |
|---|---|---|---|---|
| 2024 | $15,534 | $85,000 | $35,878 | $49,122 |
| 2023 | $17,776 | $85,000 | $35,878 | $49,122 |
| 2022 | $17,776 | $84,488 | $31,529 | $52,959 |
| 2021 | $17,192 | $84,486 | $31,528 | $52,958 |
| 2020 | $16,695 | $84,486 | $31,528 | $52,958 |
| 2019 | $17,864 | $91,285 | $28,267 | $63,018 |
| 2018 | $18,230 | $91,285 | $28,267 | $63,018 |
| 2017 | $17,573 | $91,285 | $28,267 | $63,018 |
| 2016 | $15,320 | $72,454 | $25,005 | $47,449 |
| 2015 | $15,273 | $72,454 | $25,005 | $47,449 |
| 2014 | $14,517 | $72,454 | $25,005 | $47,449 |
| 2013 | $16,712 | $85,198 | $25,005 | $60,193 |
Source: Public Records
Map
Nearby Homes
- 8080 Wolf Rd
- 124 Fairway Dr
- 11315 77th St
- 8010 Greenbriar Ct
- 11702 German Church Rd
- 11307 German Church Rd
- 10940 German Church Rd
- 8302 Pleasant View Ave
- 17 Buege Ln
- 8408 Willow Dr W
- 8120 Woodside Ln
- 8425 S Hickory Ct
- 8518 Candlelight Dr W
- 17 Ambriance Dr
- 11225 Arrowhead Trail
- 7231 Wolf Rd Unit 310C
- 8101 S County Line Rd
- 7211 Wolf Rd Unit 301A
- 450 Village Center Dr Unit 210
- 7254 Fair Elms Ave