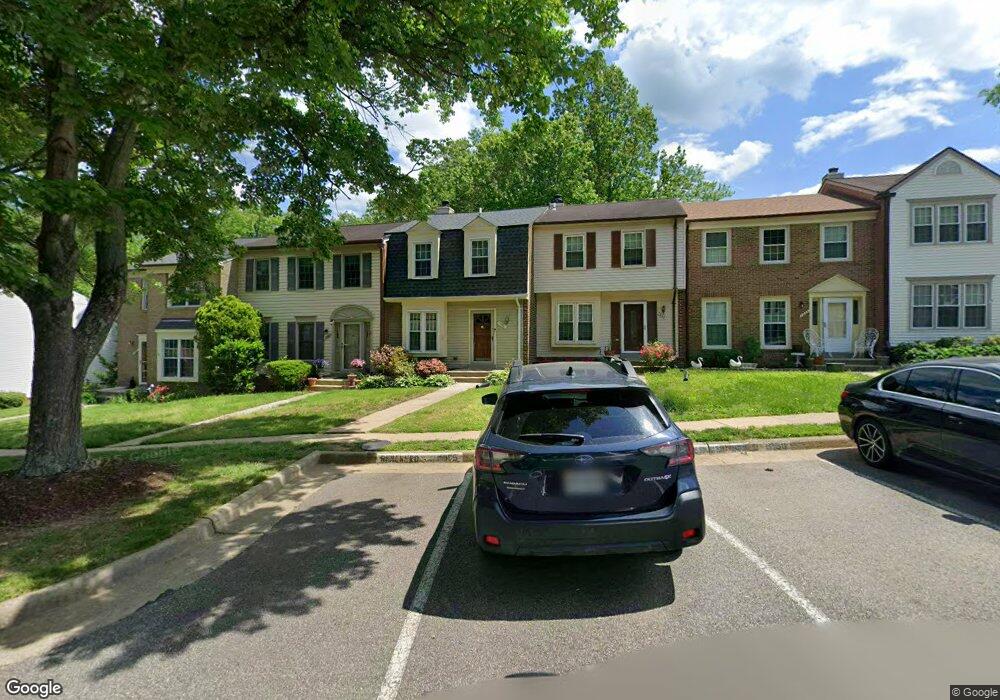
7963 Pebble Brook Ct Springfield, VA 22153
Estimated Value: $540,000 - $553,407
3
Beds
4
Baths
1,715
Sq Ft
$318/Sq Ft
Est. Value
About This Home
This home is located at 7963 Pebble Brook Ct, Springfield, VA 22153 and is currently estimated at $545,352, approximately $317 per square foot. 7963 Pebble Brook Ct is a home located in Fairfax County with nearby schools including Newington Forest Elementary School, South County Middle School, and South County High School.
Ownership History
Date
Name
Owned For
Owner Type
Purchase Details
Closed on
Dec 14, 2015
Sold by
Mendoza Hector M and Mendoza Myra V
Bought by
Mendoza Myra and Mendoza Hector M
Current Estimated Value
Home Financials for this Owner
Home Financials are based on the most recent Mortgage that was taken out on this home.
Original Mortgage
$268,000
Outstanding Balance
$212,787
Interest Rate
3.99%
Mortgage Type
New Conventional
Estimated Equity
$332,565
Purchase Details
Closed on
Jul 18, 2008
Sold by
Boyle Patrick W
Bought by
Mendoza Hector M
Home Financials for this Owner
Home Financials are based on the most recent Mortgage that was taken out on this home.
Original Mortgage
$294,350
Interest Rate
6.17%
Mortgage Type
FHA
Purchase Details
Closed on
Jun 9, 2006
Sold by
Terry Les
Bought by
Boyle Patrick W
Home Financials for this Owner
Home Financials are based on the most recent Mortgage that was taken out on this home.
Original Mortgage
$314,000
Interest Rate
6.62%
Mortgage Type
New Conventional
Create a Home Valuation Report for This Property
The Home Valuation Report is an in-depth analysis detailing your home's value as well as a comparison with similar homes in the area
Home Values in the Area
Average Home Value in this Area
Purchase History
| Date | Buyer | Sale Price | Title Company |
|---|---|---|---|
| Mendoza Myra | -- | None Available | |
| Mendoza Hector M | $320,000 | -- | |
| Boyle Patrick W | $392,500 | -- |
Source: Public Records
Mortgage History
| Date | Status | Borrower | Loan Amount |
|---|---|---|---|
| Open | Mendoza Myra | $268,000 | |
| Previous Owner | Mendoza Hector M | $294,350 | |
| Previous Owner | Boyle Patrick W | $314,000 |
Source: Public Records
Tax History
| Year | Tax Paid | Tax Assessment Tax Assessment Total Assessment is a certain percentage of the fair market value that is determined by local assessors to be the total taxable value of land and additions on the property. | Land | Improvement |
|---|---|---|---|---|
| 2025 | $5,682 | $523,010 | $190,000 | $333,010 |
| 2024 | $5,682 | $490,480 | $175,000 | $315,480 |
| 2023 | $5,117 | $453,400 | $150,000 | $303,400 |
| 2022 | $4,823 | $421,780 | $135,000 | $286,780 |
| 2021 | $4,713 | $401,600 | $125,000 | $276,600 |
| 2020 | $4,371 | $369,290 | $105,000 | $264,290 |
| 2019 | $4,227 | $357,170 | $100,000 | $257,170 |
| 2018 | $3,969 | $345,140 | $95,000 | $250,140 |
| 2017 | $3,866 | $332,980 | $90,000 | $242,980 |
| 2016 | $3,858 | $332,980 | $90,000 | $242,980 |
Source: Public Records
Map
Nearby Homes
- 8309 Magic Leaf Rd
- 7936 Saint Dennis Dr
- 7923 Lake Pleasant Dr
- 7758 Tara Heights Place
- 7752 Gamid Dr
- 8020 Pohick Rd
- 7910 Richfield Rd
- 7913 Laural Valley Way
- 7865 Parthian Ct
- 8303 White Star Ct
- 8462 Lazy Creek Ct
- 8068 Dulciana Ct
- 8431 Ambrose Ct
- 8733 Pohick Rd
- 7374 Pohick Ridge Ct
- 8545 Blue Rock Ln
- 8108 Steeple Chase Ct
- 0 Edge Creek Ln
- 7433 Spring Tree Dr
- 8371 Luce Ct
- 7965 Pebble Brook Ct
- 7961 Pebble Brook Ct
- 7967 Pebble Brook Ct
- 7959 Pebble Brook Ct
- 7969 Pebble Brook Ct
- 7957 Pebble Brook Ct
- 7955 Pebble Brook Ct
- 7953 Pebble Brook Ct
- 8002 Parklane Ct
- 7951 Pebble Brook Ct
- 7964 Pebble Brook Ct
- 7962 Pebble Brook Ct
- 7966 Pebble Brook Ct
- 7968 Pebble Brook Ct
- 7960 Pebble Brook Ct
- 7970 Pebble Brook Ct
- 7949 Pebble Brook Ct
- 7972 Pebble Brook Ct
- 7958 Pebble Brook Ct
- 7974 Pebble Brook Ct
Your Personal Tour Guide
Ask me questions while you tour the home.