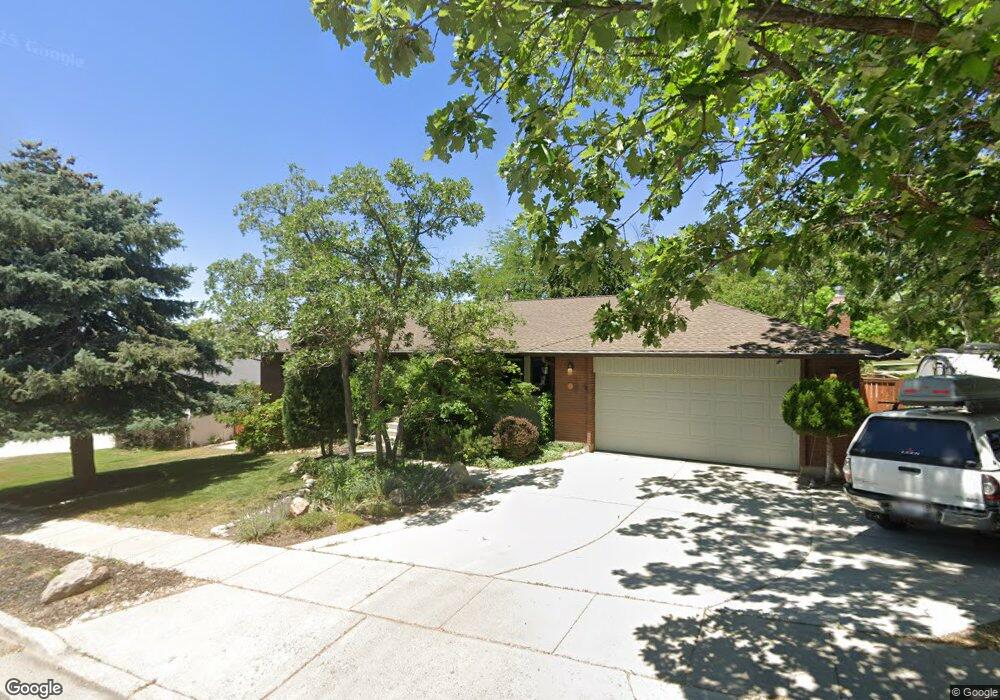
7963 S Willowcrest Rd Salt Lake City, UT 84121
Estimated Value: $870,000 - $956,000
5
Beds
3
Baths
3,802
Sq Ft
$241/Sq Ft
Est. Value
About This Home
This home is located at 7963 S Willowcrest Rd, Salt Lake City, UT 84121 and is currently estimated at $915,055, approximately $240 per square foot. 7963 S Willowcrest Rd is a home located in Salt Lake County with nearby schools including Canyon View School, Butler Middle School, and Brighton High School.
Ownership History
Date
Name
Owned For
Owner Type
Purchase Details
Closed on
Aug 4, 2021
Sold by
Jorgensen Theodore S and Jorgensen Catherine H
Bought by
Jorgensen Theodore Stephen and Jorgensen Catherine Hunter
Current Estimated Value
Purchase Details
Closed on
Dec 6, 2019
Sold by
White Alison Kaye and White David
Bought by
Jorgensen Theodore S and Jorgensen Catherine H
Purchase Details
Closed on
Feb 7, 2018
Sold by
Walfron Ruth G
Bought by
Waldron Ruiti G and White Alison Kaye
Purchase Details
Closed on
Jun 11, 1994
Sold by
Waldron Jack V and Waldron Ruth G
Bought by
Jack And Ruth Waldron Trust
Home Financials for this Owner
Home Financials are based on the most recent Mortgage that was taken out on this home.
Original Mortgage
$60,000
Interest Rate
8.56%
Purchase Details
Closed on
Oct 19, 1993
Sold by
Waldron Jack and Waldron Ruth
Bought by
Jack And Ruth Waldron Trust
Create a Home Valuation Report for This Property
The Home Valuation Report is an in-depth analysis detailing your home's value as well as a comparison with similar homes in the area
Home Values in the Area
Average Home Value in this Area
Purchase History
| Date | Buyer | Sale Price | Title Company |
|---|---|---|---|
| Jorgensen Theodore Stephen | -- | None Available | |
| Jorgensen Theodore S | -- | Highland Title Agency | |
| Waldron Ruiti G | -- | None Available | |
| Jack And Ruth Waldron Trust | -- | -- | |
| Waldron Jack V | -- | -- | |
| Jack And Ruth Waldron Trust | -- | -- | |
| Waldron Jack | -- | -- |
Source: Public Records
Mortgage History
| Date | Status | Borrower | Loan Amount |
|---|---|---|---|
| Previous Owner | Waldron Jack V | $60,000 |
Source: Public Records
Tax History Compared to Growth
Tax History
| Year | Tax Paid | Tax Assessment Tax Assessment Total Assessment is a certain percentage of the fair market value that is determined by local assessors to be the total taxable value of land and additions on the property. | Land | Improvement |
|---|---|---|---|---|
| 2025 | $49 | $867,000 | $256,000 | $611,000 |
| 2024 | $49 | $775,800 | $246,400 | $529,400 |
| 2023 | $965 | $747,500 | $236,900 | $510,600 |
| 2022 | $3,018 | $736,600 | $232,300 | $504,300 |
| 2021 | $1,791 | $550,500 | $179,800 | $370,700 |
| 2020 | $3,742 | $500,800 | $179,800 | $321,000 |
| 2019 | $3,482 | $431,200 | $169,600 | $261,600 |
| 2018 | $3,219 | $426,800 | $169,600 | $257,200 |
| 2017 | $3,159 | $414,000 | $169,600 | $244,400 |
| 2016 | $3,013 | $383,000 | $152,800 | $230,200 |
| 2015 | $2,858 | $336,600 | $162,000 | $174,600 |
| 2014 | $2,799 | $320,400 | $157,400 | $163,000 |
Source: Public Records
Map
Nearby Homes
- 7911 Willowcrest Rd
- 8022 Deer Creek Rd
- 3181 E Deer Creek Cove
- 8035 S Danish Rd
- 3338 E Creek Rd
- 3364 E Creek Rd
- 3388 E Stonehill Ln
- 2935 E Denmark Dr
- 7622 S Cambria Cir
- 3522 Bengal Blvd
- 7726 S 3500 E
- 3143 E Bavarian Ct
- 8135 Clover Spring Ln
- 3558 E Wasatch Grove Ln
- 3599 Avondale Dr
- 7657 Avondale Dr
- 2862 E Pamela Dr
- 7736 S Avondale Dr
- 3556 E Rustic Spring Ln
- 3411 Enchanted View Dr
- 7963 S Willowcrest Rd
- 7912 S Deer Creek Rd
- 7912 Deer Creek Rd
- 3232 Willowcrest Rd
- 7945 Willowcrest Rd
- 7927 Deer Creek Rd
- 7954 S Willowcrest Rd
- 7904 Deer Creek Rd
- 7954 Willowcrest Rd
- 7923 Willowcrest Rd
- 7913 Deer Creek Rd
- 7978 S Deer Creek Rd
- 7978 Deer Creek Rd
- 7911 S Willowcrest Rd
- 3280 Deer Creek Cove
- 3281 Deer Creek Cove
- 7890 Deer Creek Rd
- 3280 Vera Cir
- 7952 S Willowcrest Rd
- 3280 E Vera Cir