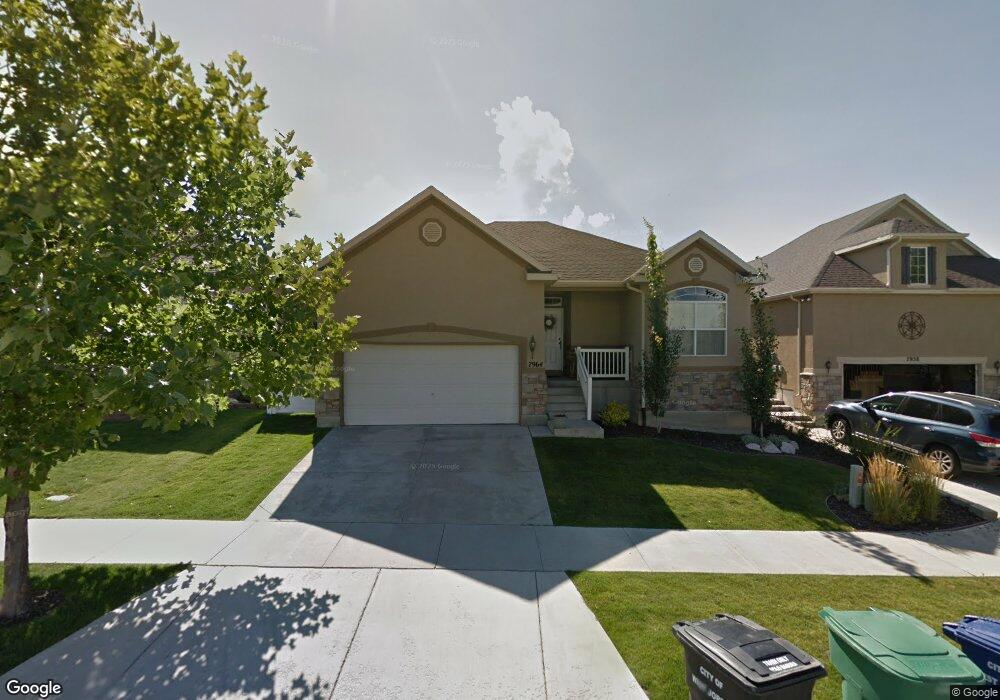
7964 S Big Sycamore Dr West Jordan, UT 84081
Jordan Hills NeighborhoodEstimated Value: $555,000 - $591,870
5
Beds
3
Baths
2,854
Sq Ft
$202/Sq Ft
Est. Value
About This Home
This home is located at 7964 S Big Sycamore Dr, West Jordan, UT 84081 and is currently estimated at $576,468, approximately $201 per square foot. 7964 S Big Sycamore Dr is a home located in Salt Lake County with nearby schools including Sunset Ridge Middle School, Copper Hills High School, and Ascent Academies of Utah West Jordan.
Ownership History
Date
Name
Owned For
Owner Type
Purchase Details
Closed on
Aug 16, 2013
Sold by
Nielson Jason Scott and Nielson Nicole T
Bought by
Chapple Scott M and Chapple Heather D
Current Estimated Value
Home Financials for this Owner
Home Financials are based on the most recent Mortgage that was taken out on this home.
Original Mortgage
$237,500
Outstanding Balance
$175,842
Interest Rate
4.28%
Mortgage Type
New Conventional
Estimated Equity
$400,626
Purchase Details
Closed on
Dec 28, 2010
Sold by
Fannie Mae
Bought by
Nielson Jason Scott and Nielson Nicole T
Home Financials for this Owner
Home Financials are based on the most recent Mortgage that was taken out on this home.
Original Mortgage
$190,056
Interest Rate
4.34%
Mortgage Type
FHA
Purchase Details
Closed on
Dec 17, 2010
Sold by
Riveron Ray
Bought by
Federal National Mortgage Association
Home Financials for this Owner
Home Financials are based on the most recent Mortgage that was taken out on this home.
Original Mortgage
$190,056
Interest Rate
4.34%
Mortgage Type
FHA
Purchase Details
Closed on
Dec 27, 2004
Sold by
Richmond American Homes Of Utah Inc
Bought by
Riveron Ray
Create a Home Valuation Report for This Property
The Home Valuation Report is an in-depth analysis detailing your home's value as well as a comparison with similar homes in the area
Home Values in the Area
Average Home Value in this Area
Purchase History
| Date | Buyer | Sale Price | Title Company |
|---|---|---|---|
| Chapple Scott M | -- | Eagle Gate Title Ins Agcy | |
| Nielson Jason Scott | $195,000 | United Title Services | |
| Federal National Mortgage Association | $300,700 | Trustees Title & Escrow Lc | |
| Riveron Ray | -- | First American Title |
Source: Public Records
Mortgage History
| Date | Status | Borrower | Loan Amount |
|---|---|---|---|
| Open | Chapple Scott M | $237,500 | |
| Closed | Nielson Jason Scott | $190,056 |
Source: Public Records
Tax History Compared to Growth
Tax History
| Year | Tax Paid | Tax Assessment Tax Assessment Total Assessment is a certain percentage of the fair market value that is determined by local assessors to be the total taxable value of land and additions on the property. | Land | Improvement |
|---|---|---|---|---|
| 2025 | $2,852 | $567,600 | $133,400 | $434,200 |
| 2024 | $2,852 | $548,700 | $128,900 | $419,800 |
| 2023 | $2,948 | $534,500 | $126,400 | $408,100 |
| 2022 | $3,024 | $539,400 | $123,900 | $415,500 |
| 2021 | $2,432 | $395,000 | $98,300 | $296,700 |
| 2020 | $2,309 | $351,900 | $98,300 | $253,600 |
| 2019 | $2,264 | $338,400 | $98,300 | $240,100 |
| 2018 | $2,130 | $315,700 | $95,400 | $220,300 |
| 2017 | $2,004 | $295,700 | $95,400 | $200,300 |
| 2016 | $1,964 | $272,300 | $95,400 | $176,900 |
| 2015 | $2,010 | $271,800 | $97,200 | $174,600 |
| 2014 | $1,929 | $256,700 | $92,700 | $164,000 |
Source: Public Records
Map
Nearby Homes
- 7953 S 7110 W
- 7169 Moorepark Place
- 7182 Moorepark Place Unit 10
- 7069 W Cottage Point Dr
- 7176 Moorepark Place
- 7011 W Saw Timber Way
- 7009 W 7895 S
- Witzel Plan at The Sycamores
- Beatrix Plan at The Sycamores
- Sweetwater Plan at The Sycamores
- Princeton Plan at The Sycamores
- Dakota Plan at The Sycamores
- Dashell Plan at The Sycamores
- Roosevelt Plan at The Sycamores
- Wasatch Plan at The Sycamores
- 7776 S Iron Core Ln
- 7853 Flattop Mount Dr Unit 356
- 8169 S Flaxton Ln
- 7171 W 8170 S
- 7106 W 7800 S Unit 250
- 7964 Big Sycamore Dr
- 7974 S Big Sycamore Dr
- 7974 Big Sycamore Dr
- 7958 S Big Sycamore Dr
- 7958 Big Sycamore Dr
- 7982 S Big Sycamore Dr
- 7982 Big Sycamore Dr
- 7948 S Big Sycamore Dr
- 7948 Big Sycamore Dr
- 7963 Big Sycamore Dr
- 7973 Big Sycamore Dr
- 7988 Big Sycamore Dr
- 7973 S Big Sycamore Dr
- 7148 W Big Sycamore Dr
- 7983 S Big Sycamore Dr
- 7983 Big Sycamore Dr
- 7996 S Big Sycamore Dr
- 7996 Big Sycamore Dr
- 7967 Old Flaxton Ct
- 7967 S Old Flaxton Ct