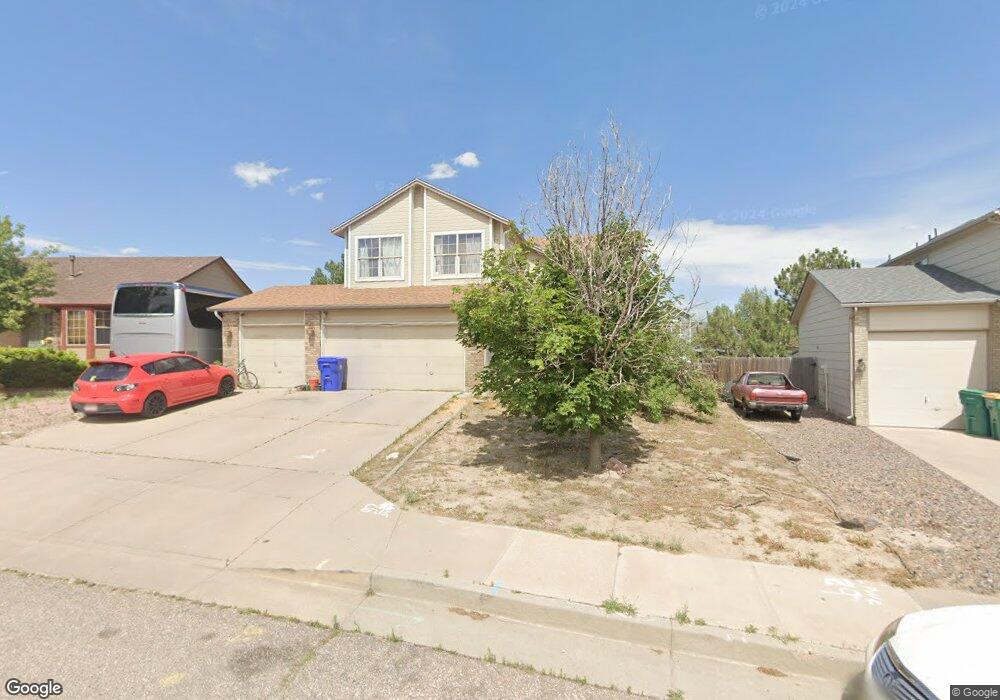
7965 Manston Dr Colorado Springs, CO 80920
Briargate NeighborhoodEstimated Value: $527,713 - $583,000
4
Beds
4
Baths
1,987
Sq Ft
$281/Sq Ft
Est. Value
About This Home
This home is located at 7965 Manston Dr, Colorado Springs, CO 80920 and is currently estimated at $557,428, approximately $280 per square foot. 7965 Manston Dr is a home located in El Paso County with nearby schools including Prairie Hills Elementary School, Timberview Middle School, and Liberty High School.
Ownership History
Date
Name
Owned For
Owner Type
Purchase Details
Closed on
Apr 20, 2009
Sold by
Thomas Eric J and Thomas Jill F
Bought by
Stanley Billy
Current Estimated Value
Home Financials for this Owner
Home Financials are based on the most recent Mortgage that was taken out on this home.
Original Mortgage
$279,000
Outstanding Balance
$177,223
Interest Rate
5.03%
Mortgage Type
VA
Estimated Equity
$380,205
Purchase Details
Closed on
Aug 16, 2007
Sold by
Lane Mark A and Lane Nicole G
Bought by
Thomas Eric J and Thomas Jill F
Home Financials for this Owner
Home Financials are based on the most recent Mortgage that was taken out on this home.
Original Mortgage
$224,000
Interest Rate
6.69%
Mortgage Type
Unknown
Purchase Details
Closed on
Jan 28, 1998
Sold by
Hallmark Building Company Ltd I
Bought by
Lane Mark A and Lane Nicole G
Home Financials for this Owner
Home Financials are based on the most recent Mortgage that was taken out on this home.
Original Mortgage
$180,976
Interest Rate
7%
Mortgage Type
VA
Create a Home Valuation Report for This Property
The Home Valuation Report is an in-depth analysis detailing your home's value as well as a comparison with similar homes in the area
Home Values in the Area
Average Home Value in this Area
Purchase History
| Date | Buyer | Sale Price | Title Company |
|---|---|---|---|
| Stanley Billy | $279,000 | Empire Title Co Springs Llc | |
| Thomas Eric J | $280,000 | Security Title | |
| Lane Mark A | $177,400 | Stewart Title |
Source: Public Records
Mortgage History
| Date | Status | Borrower | Loan Amount |
|---|---|---|---|
| Open | Stanley Billy | $279,000 | |
| Previous Owner | Thomas Eric J | $224,000 | |
| Previous Owner | Lane Mark A | $180,976 |
Source: Public Records
Tax History Compared to Growth
Tax History
| Year | Tax Paid | Tax Assessment Tax Assessment Total Assessment is a certain percentage of the fair market value that is determined by local assessors to be the total taxable value of land and additions on the property. | Land | Improvement |
|---|---|---|---|---|
| 2025 | $2,086 | $37,120 | -- | -- |
| 2024 | $2,048 | $36,250 | $5,360 | $30,890 |
| 2023 | $2,048 | $36,250 | $5,360 | $30,890 |
| 2022 | $1,899 | $26,910 | $4,340 | $22,570 |
| 2021 | $1,978 | $27,680 | $4,460 | $23,220 |
| 2020 | $1,890 | $24,550 | $3,720 | $20,830 |
| 2019 | $1,870 | $24,550 | $3,720 | $20,830 |
| 2018 | $1,648 | $21,260 | $2,880 | $18,380 |
| 2017 | $1,642 | $21,260 | $2,880 | $18,380 |
| 2016 | $1,551 | $20,060 | $2,930 | $17,130 |
| 2015 | $1,548 | $20,060 | $2,930 | $17,130 |
| 2014 | $1,421 | $18,400 | $2,930 | $15,470 |
Source: Public Records
Map
Nearby Homes
- 5026 Plumstead Dr
- 5050 Plumstead Dr
- 7820 Swiftrun Rd
- 7985 Interlaken Dr
- 7691 Scarborough Dr
- 7775 Manston Dr
- 8030 Chancellor Dr
- 7705 Chancellor Dr
- 5305 Plumstead Dr
- 8313 Scarborough Dr
- 8372 Wilmington Dr
- 7590 Chancellor Dr
- 8387 Snow Cap View
- 8488 Grand Peak Vista Point
- 8482 Artesian Springs Point
- 5062 Baseline View
- 7543 Potomac Dr
- 8405 Andrus Dr
- 4940 Deviation Point
- 4455 Archwood Dr
- 7955 Manston Dr
- 5111 Vienna Way
- 5107 Vienna Way
- 7945 Manston Dr
- 5115 Vienna Way
- 5096 Oyster Bay Dr
- 5110 Vienna Way
- 7940 Manston Dr
- 7935 Manston Dr
- 5113 Oyster Bay Dr
- 7930 Manston Dr
- 7850 Potomac Dr
- 5119 Vienna Way
- 5114 Vienna Way
- 5117 Oyster Bay Dr
- 5090 Oyster Bay Dr
- 7925 Manston Dr
- 7846 Potomac Dr
- 7920 Manston Dr
- 5121 Oyster Bay Dr