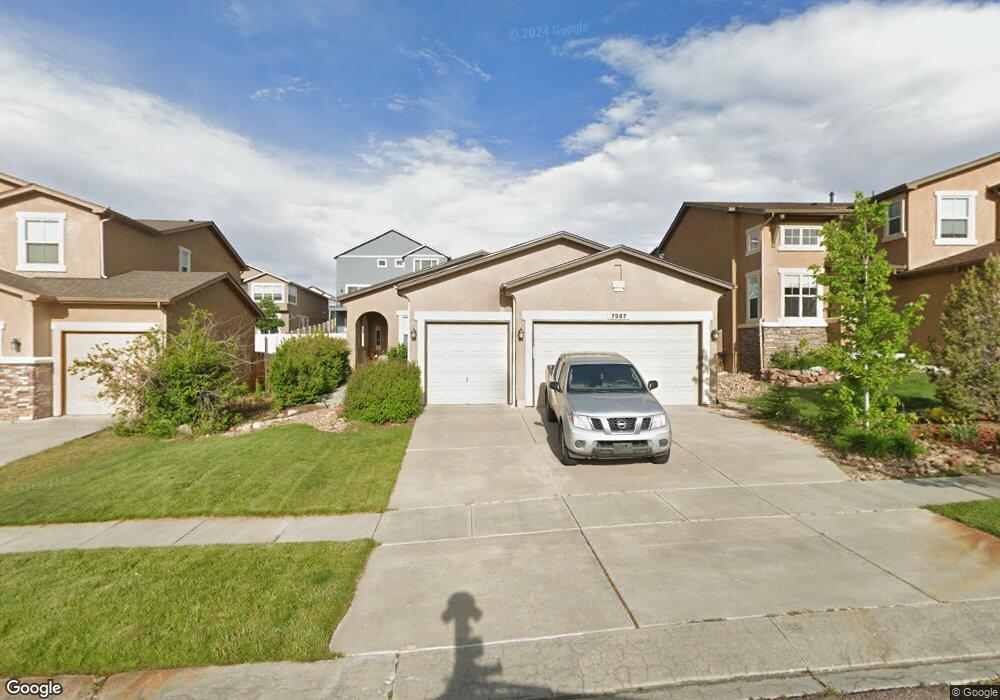
7967 Mount Huron Trail Colorado Springs, CO 80924
Wolf Ranch NeighborhoodEstimated Value: $527,000 - $604,976
4
Beds
3
Baths
3,290
Sq Ft
$175/Sq Ft
Est. Value
About This Home
This home is located at 7967 Mount Huron Trail, Colorado Springs, CO 80924 and is currently estimated at $576,244, approximately $175 per square foot. 7967 Mount Huron Trail is a home located in El Paso County with nearby schools including Legacy Peak Elementary School, Chinook Trail Middle School, and Liberty High School.
Ownership History
Date
Name
Owned For
Owner Type
Purchase Details
Closed on
Dec 5, 2019
Sold by
Bowman Cheryl Lincoln
Bought by
Anderson Mark T and Anderson Karri A
Current Estimated Value
Home Financials for this Owner
Home Financials are based on the most recent Mortgage that was taken out on this home.
Original Mortgage
$410,000
Outstanding Balance
$362,531
Interest Rate
3.75%
Mortgage Type
VA
Estimated Equity
$213,713
Purchase Details
Closed on
May 9, 2017
Sold by
Mauna Veronica A and Mauna Anthony N
Bought by
Bowman Cheryl Lincoln
Purchase Details
Closed on
Nov 17, 2009
Sold by
Keller Homes Inc
Bought by
Mauna Anthony N and Mauna Veronica A
Home Financials for this Owner
Home Financials are based on the most recent Mortgage that was taken out on this home.
Original Mortgage
$341,750
Interest Rate
4.83%
Mortgage Type
VA
Purchase Details
Closed on
Jul 15, 2009
Sold by
Kf 103 & Cv Llc
Bought by
Keller Homes Inc
Create a Home Valuation Report for This Property
The Home Valuation Report is an in-depth analysis detailing your home's value as well as a comparison with similar homes in the area
Home Values in the Area
Average Home Value in this Area
Purchase History
| Date | Buyer | Sale Price | Title Company |
|---|---|---|---|
| Anderson Mark T | $410,000 | Fidelity National Title | |
| Bowman Cheryl Lincoln | $355,000 | Gurdian Title | |
| Mauna Anthony N | $330,879 | Land Title Guarantee Company | |
| Keller Homes Inc | $86,000 | None Available |
Source: Public Records
Mortgage History
| Date | Status | Borrower | Loan Amount |
|---|---|---|---|
| Open | Anderson Mark T | $410,000 | |
| Previous Owner | Mauna Anthony N | $341,750 |
Source: Public Records
Tax History Compared to Growth
Tax History
| Year | Tax Paid | Tax Assessment Tax Assessment Total Assessment is a certain percentage of the fair market value that is determined by local assessors to be the total taxable value of land and additions on the property. | Land | Improvement |
|---|---|---|---|---|
| 2025 | $3,175 | $39,050 | -- | -- |
| 2024 | $3,139 | $37,570 | $6,030 | $31,540 |
| 2023 | $3,139 | $37,570 | $6,030 | $31,540 |
| 2022 | $2,800 | $26,750 | $5,590 | $21,160 |
| 2021 | $3,537 | $27,530 | $5,760 | $21,770 |
| 2020 | $3,515 | $24,700 | $5,010 | $19,690 |
| 2019 | $3,580 | $24,700 | $5,010 | $19,690 |
| 2018 | $3,563 | $24,850 | $4,320 | $20,530 |
| 2017 | $3,557 | $24,850 | $4,320 | $20,530 |
| 2016 | $3,436 | $24,850 | $4,140 | $20,710 |
| 2015 | $3,484 | $24,850 | $4,140 | $20,710 |
| 2014 | $3,386 | $24,120 | $4,140 | $19,980 |
Source: Public Records
Map
Nearby Homes
- 7977 Mount Huron Trail
- 6678 Cumbre Vista Way
- 8044 Hunter Peak Trail
- 6222 Barr Point
- 7721 Crestone Peak Trail
- 6183 Magma Heights
- 6251 Stonefly Dr
- 8407 Caddis Ct
- 6541 Stonefly Dr
- 6069 Inman View
- 6750 Foxtrot Ln
- 6350 Stonefly Dr
- 7768 Bone Creek Point
- 8426 Mayfly Dr
- 7754 Herard View
- 7732 Tuttle View
- 7720 Tuttle View
- 8269 Misty Moon Dr
- 7780 Desert Wrangler Dr
- 7823 Desert Wrangler Dr
- 7957 Mount Huron Trail
- 8036 Gilpin Peak Dr
- 8042 Gilpin Peak Dr
- 8048 Gilpin Peak Dr
- 8030 Gilpin Peak Dr
- 7987 Mount Huron Trail
- 7937 Mount Huron Trail
- 8024 Gilpin Peak Dr
- 8054 Gilpin Peak Dr
- 7978 Mount Huron Trail
- 7958 Mount Huron Trail
- 7997 Mount Huron Trail
- 8018 Gilpin Peak Dr
- 7988 Mount Huron Trail
- 7948 Mount Huron Trail
- 8060 Gilpin Peak Dr
- 8007 Mount Huron Trail
- 8035 Gilpin Peak Dr
- 7998 Mount Huron Trail
- 8041 Gilpin Peak Dr