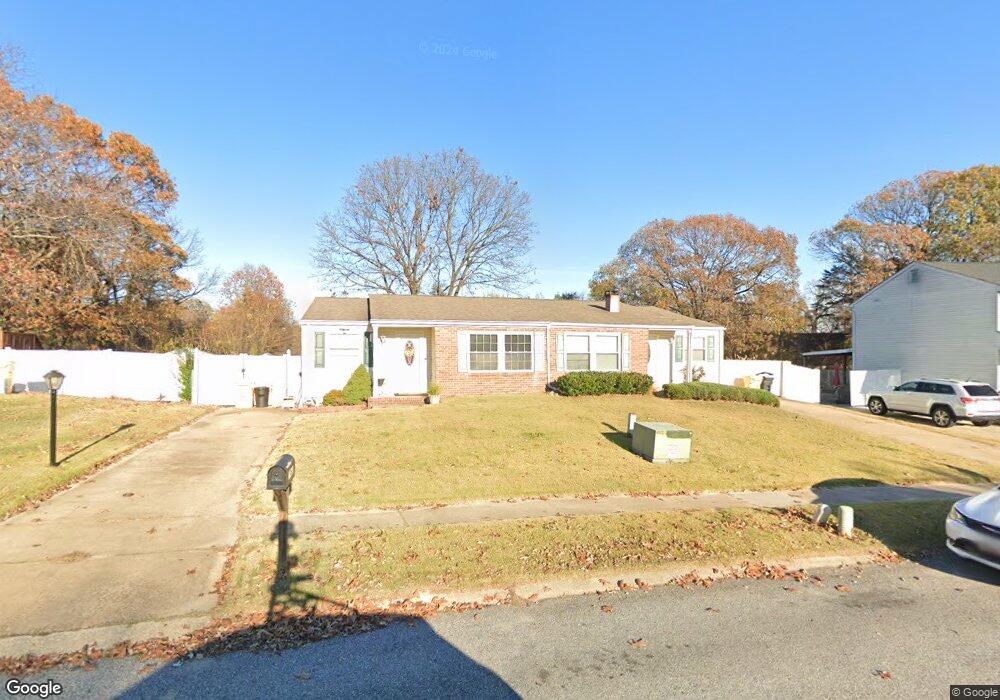
7969 Covington Ave Glen Burnie, MD 21061
Estimated Value: $342,000 - $366,000
3
Beds
2
Baths
1,435
Sq Ft
$246/Sq Ft
Est. Value
About This Home
This home is located at 7969 Covington Ave, Glen Burnie, MD 21061 and is currently estimated at $353,617, approximately $246 per square foot. 7969 Covington Ave is a home located in Anne Arundel County with nearby schools including Quarterfield Elementary School, Corkran Middle School, and Glen Burnie High School.
Ownership History
Date
Name
Owned For
Owner Type
Purchase Details
Closed on
Mar 23, 2011
Sold by
Holsey Carey D
Bought by
Smith Andrea M
Current Estimated Value
Home Financials for this Owner
Home Financials are based on the most recent Mortgage that was taken out on this home.
Original Mortgage
$5,000
Outstanding Balance
$3,444
Interest Rate
4.84%
Mortgage Type
Purchase Money Mortgage
Estimated Equity
$350,173
Purchase Details
Closed on
Mar 4, 2011
Sold by
Holsey Carey D
Bought by
Smith Andrea M
Home Financials for this Owner
Home Financials are based on the most recent Mortgage that was taken out on this home.
Original Mortgage
$5,000
Outstanding Balance
$3,444
Interest Rate
4.84%
Mortgage Type
Purchase Money Mortgage
Estimated Equity
$350,173
Purchase Details
Closed on
Feb 10, 2003
Sold by
Holsey Carey A
Bought by
Holsey Carey D and Holsey Susan L
Create a Home Valuation Report for This Property
The Home Valuation Report is an in-depth analysis detailing your home's value as well as a comparison with similar homes in the area
Home Values in the Area
Average Home Value in this Area
Purchase History
| Date | Buyer | Sale Price | Title Company |
|---|---|---|---|
| Smith Andrea M | $225,000 | -- | |
| Smith Andrea M | $225,000 | -- | |
| Smith Andrea M | $225,000 | -- | |
| Smith Andrea M | $225,000 | -- | |
| Holsey Carey D | $115,000 | -- |
Source: Public Records
Mortgage History
| Date | Status | Borrower | Loan Amount |
|---|---|---|---|
| Open | Smith Andrea M | $5,000 | |
| Closed | Smith Andrea M | $5,000 | |
| Open | Smith Andrea M | $219,296 | |
| Closed | Smith Andrea M | $219,296 | |
| Closed | Smith Andrea M | $219,296 | |
| Closed | Holsey Carey D | -- |
Source: Public Records
Tax History Compared to Growth
Tax History
| Year | Tax Paid | Tax Assessment Tax Assessment Total Assessment is a certain percentage of the fair market value that is determined by local assessors to be the total taxable value of land and additions on the property. | Land | Improvement |
|---|---|---|---|---|
| 2025 | $3,027 | $286,000 | $111,500 | $174,500 |
| 2024 | $3,027 | $272,500 | $0 | $0 |
| 2023 | $2,400 | $259,000 | $0 | $0 |
| 2022 | $2,725 | $245,500 | $114,000 | $131,500 |
| 2021 | $5,365 | $242,333 | $0 | $0 |
| 2020 | $2,616 | $239,167 | $0 | $0 |
| 2019 | $2,562 | $236,000 | $109,000 | $127,000 |
| 2018 | $2,229 | $219,800 | $0 | $0 |
| 2017 | $2,399 | $203,600 | $0 | $0 |
| 2016 | -- | $187,400 | $0 | $0 |
| 2015 | -- | $187,400 | $0 | $0 |
| 2014 | -- | $187,400 | $0 | $0 |
Source: Public Records
Map
Nearby Homes
- 7940 E Park Dr
- 7965 Quail Ct
- 352 Mae Rd
- 7917 Parke Dr W
- 504 Elizabeth Rd
- 720 Hyde Park Dr
- 714 Hyde Park Dr
- 7903 Covington Ave
- 516 Joy Cir
- 8049 Veterans Hwy Unit TRLR 52
- 528 Glen Ct
- 366 Phirne Rd W
- 505 Baylor Rd
- 7922 Crain Hwy S
- 521 Baylor Rd
- 7805 Keenan Rd
- 227 Jenkins Way
- 235 Jenkins Way
- 204 Jenkins Way
- 8132 Cloverhurst Rd
- 7971 Covington Ave
- 7967 Covington Ave
- 7973 Covington Ave
- 7965 Covington Ave
- 7975 Covington Ave
- 7963 Covington Ave
- 7977 Covington Ave
- 7968 Covington Ave
- 7970 Covington Ave
- 7979 Covington Ave
- 7966 Covington Ave
- 7972 Covington Ave
- 7949 Parke West Dr
- 7964 Covington Ave
- 664 Quail Dr
- 664B Quail Dr
- 7951 Parke Dr W
- 7981 Covington Ave
- 7974 Covington Ave
- 7951 Parke West Dr