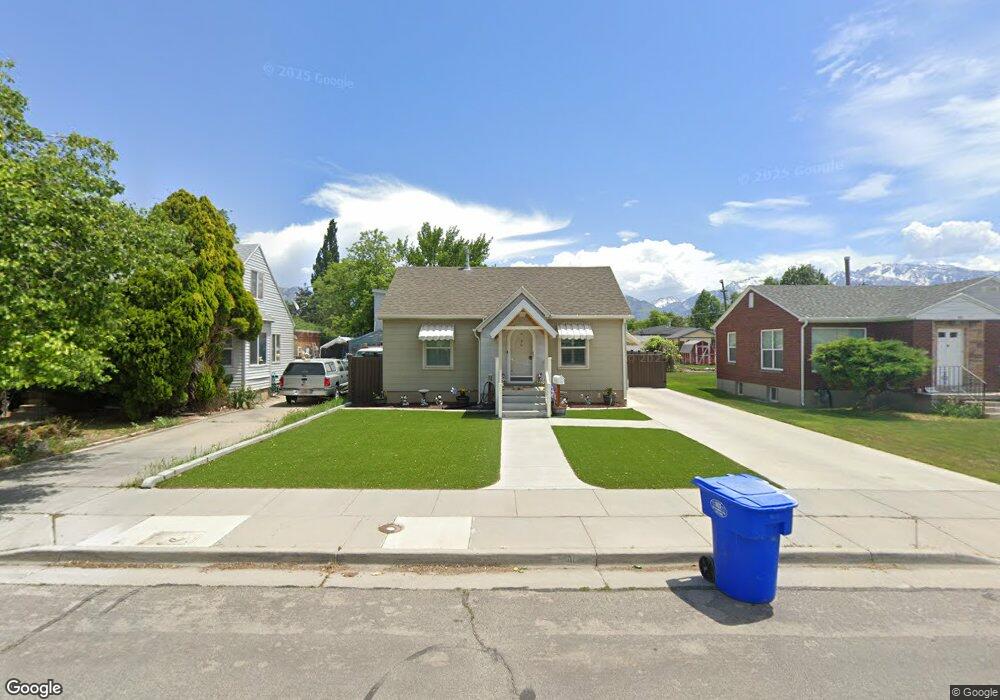
7969 S Grant St Midvale, UT 84047
Estimated Value: $420,571 - $487,000
3
Beds
2
Baths
1,656
Sq Ft
$274/Sq Ft
Est. Value
About This Home
This home is located at 7969 S Grant St, Midvale, UT 84047 and is currently estimated at $453,393, approximately $273 per square foot. 7969 S Grant St is a home located in Salt Lake County with nearby schools including Midvale Elementary School, Midvale Middle School, and Hillcrest High School.
Ownership History
Date
Name
Owned For
Owner Type
Purchase Details
Closed on
Sep 22, 2015
Sold by
Wiggins Jeromy Scott and Wiggins Jeromy S
Bought by
Wiggins Jeromy Scott and Wiggins Elisha
Current Estimated Value
Home Financials for this Owner
Home Financials are based on the most recent Mortgage that was taken out on this home.
Original Mortgage
$160,000
Outstanding Balance
$125,584
Interest Rate
3.89%
Mortgage Type
New Conventional
Estimated Equity
$327,809
Purchase Details
Closed on
Apr 29, 2011
Sold by
Maughan Wayne
Bought by
Wiggins Jeromy S
Home Financials for this Owner
Home Financials are based on the most recent Mortgage that was taken out on this home.
Original Mortgage
$154,481
Interest Rate
4.5%
Mortgage Type
FHA
Purchase Details
Closed on
Oct 28, 2010
Sold by
Kidd James Wallace
Bought by
Maughan Wayne
Purchase Details
Closed on
Oct 10, 2008
Sold by
Dimond Harriet Alice
Bought by
Kidd James Wallace and Harriet Alice Dimond Family Trust
Create a Home Valuation Report for This Property
The Home Valuation Report is an in-depth analysis detailing your home's value as well as a comparison with similar homes in the area
Home Values in the Area
Average Home Value in this Area
Purchase History
| Date | Buyer | Sale Price | Title Company |
|---|---|---|---|
| Wiggins Jeromy Scott | -- | Placer Title Ins Agency Of U | |
| Wiggins Jeromy S | -- | Advanced Title Slc | |
| Maughan Wayne | -- | First American Title | |
| Kidd James Wallace | -- | None Available |
Source: Public Records
Mortgage History
| Date | Status | Borrower | Loan Amount |
|---|---|---|---|
| Open | Wiggins Jeromy Scott | $160,000 | |
| Closed | Wiggins Jeromy S | $154,481 |
Source: Public Records
Tax History
| Year | Tax Paid | Tax Assessment Tax Assessment Total Assessment is a certain percentage of the fair market value that is determined by local assessors to be the total taxable value of land and additions on the property. | Land | Improvement |
|---|---|---|---|---|
| 2025 | $2,274 | $405,900 | $127,800 | $278,100 |
| 2024 | $2,274 | $387,900 | $120,900 | $267,000 |
| 2023 | $2,221 | $376,200 | $114,900 | $261,300 |
| 2022 | $2,341 | $387,200 | $112,700 | $274,500 |
| 2021 | $2,142 | $304,000 | $103,300 | $200,700 |
| 2020 | $1,821 | $244,900 | $75,100 | $169,800 |
| 2019 | $1,693 | $222,200 | $70,400 | $151,800 |
| 2016 | $1,585 | $197,700 | $70,400 | $127,300 |
Source: Public Records
Map
Nearby Homes
- 7865 S Grant St
- 7987 S Grant St
- 254 Pioneer Cir Unit 256
- 197 W Center St
- 8154 S Roosevelt St
- 222 W Center St
- 108 W Ryker Ln Unit 16
- 332 W Harvard Dr
- 396 Harvard Dr
- 311 Marquette Dr
- 7571 S Blisswood Dr #20 Dr Unit 20
- 36 Marquette Dr
- 7689 Locust St
- 135 E Station St
- 8343 Monroe St
- 74 E Resaca Dr Unit B12
- 8229 S Resaca Dr Unit D9
- 90 E Resaca Dr Unit C11
- 8404 S Monroe St
- 36 E Opequon Rd
- 7969 Grant St
- 7977 Grant St
- 7961 Grant St
- 7977 S Grant St
- 176 Grant St
- 7953 Grant St
- 7983 Grant St
- 7964 Roosevelt St
- 7943 Grant St
- 7952 Roosevelt St
- 7980 Roosevelt St
- 7987 Grant St
- 7936 Roosevelt St
- 7970 Grant St
- 7970 S Grant St
- 7933 Grant St
- 7933 S Grant St
- 7962 S Grant St
- 7976 Grant St
- 7962 Grant St
Your Personal Tour Guide
Ask me questions while you tour the home.