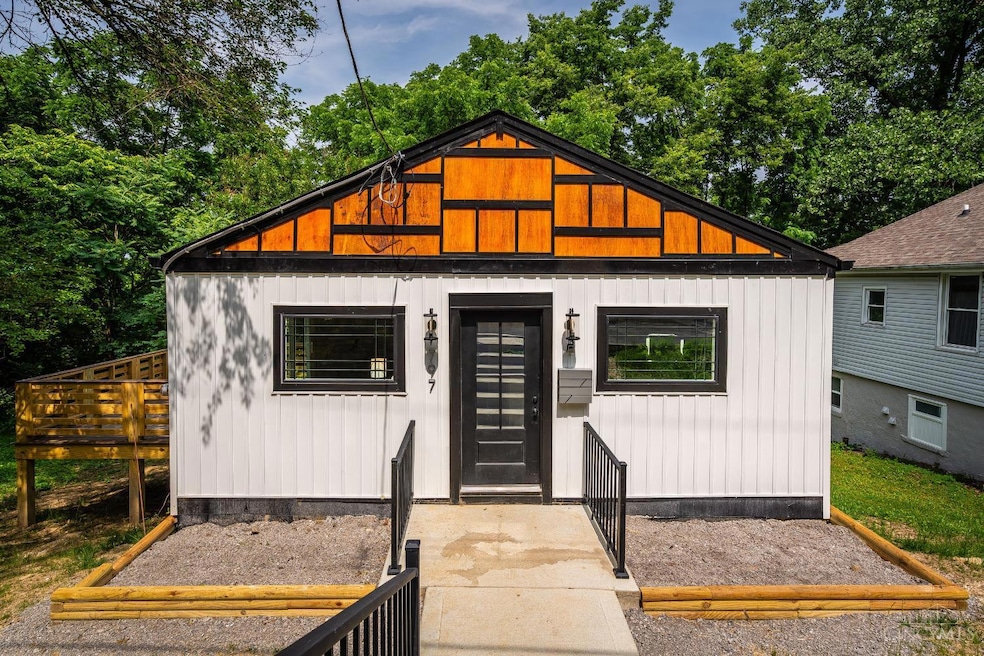
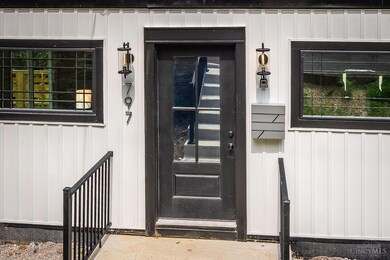
797 4th St Cincinnati, OH 45215
Estimated payment $1,501/month
Highlights
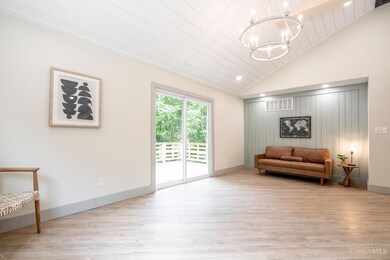
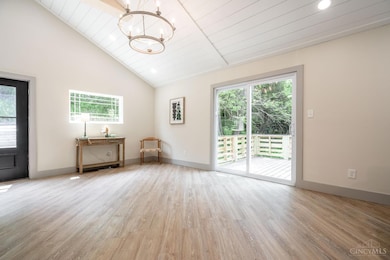
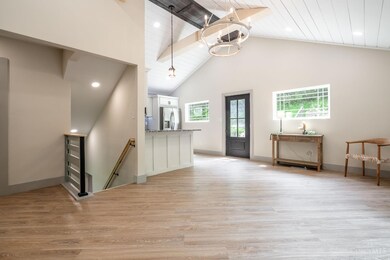
- Vaulted Ceiling
- Marble Flooring
- Walk-In Closet
- Ranch Style House
- No HOA
- Breakfast Bar
About This Home
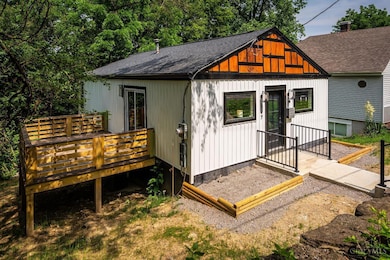
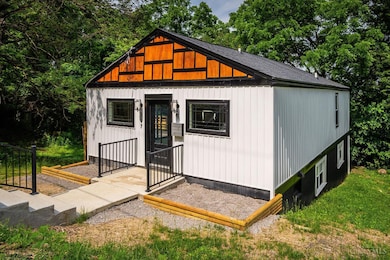
Unique and surprise await in this beautiful remodeled home. Vaulted ceilings, open floor plan, granite counters sit on new cabinets with under cab lighting. Huge double bowl vanity. Primary bdrm has large walk in closet! trex decking and double lot. New windows, new heat/air, new roof and new siding all situated at the end of the street
Listing Agent
Matt Ostendorf
Renovated Realty, LLC License #2014000568 Listed on: 05/30/2025

Home Details
Home Type
- Single Family
Est. Annual Taxes
- $652
Year Built
- Built in 1940
Lot Details
- 5,489 Sq Ft Lot
- Lot Dimensions are 110x50
Home Design
- Ranch Style House
- Block Foundation
- Shingle Roof
- Vinyl Siding
Interior Spaces
- 984 Sq Ft Home
- Vaulted Ceiling
- Vinyl Clad Windows
- Breakfast Bar
Flooring
- Marble
- Vinyl
Bedrooms and Bathrooms
- 3 Bedrooms
- Walk-In Closet
- 2 Full Bathrooms
- Dual Vanity Sinks in Primary Bathroom
- Bathtub with Shower
Finished Basement
- Walk-Out Basement
- Basement Fills Entire Space Under The House
Utilities
- Central Air
- Heating System Uses Gas
- Gas Water Heater
Community Details
- No Home Owners Association
Map
Home Values in the Area
Average Home Value in this Area
Tax History
| Year | Tax Paid | Tax Assessment Tax Assessment Total Assessment is a certain percentage of the fair market value that is determined by local assessors to be the total taxable value of land and additions on the property. | Land | Improvement |
|---|---|---|---|---|
| 2024 | $652 | $22,666 | $8,736 | $13,930 |
| 2023 | $704 | $22,666 | $8,736 | $13,930 |
| 2022 | $598 | $17,655 | $7,025 | $10,630 |
| 2021 | $488 | $17,655 | $7,025 | $10,630 |
| 2020 | $506 | $17,655 | $7,025 | $10,630 |
| 2019 | $425 | $15,624 | $6,216 | $9,408 |
| 2018 | $426 | $15,624 | $6,216 | $9,408 |
| 2017 | $395 | $15,624 | $6,216 | $9,408 |
| 2016 | $444 | $16,590 | $6,587 | $10,003 |
| 2015 | $456 | $16,590 | $6,587 | $10,003 |
| 2014 | $398 | $16,590 | $6,587 | $10,003 |
| 2013 | $413 | $16,926 | $6,720 | $10,206 |
Property History
| Date | Event | Price | List to Sale | Price per Sq Ft |
|---|---|---|---|---|
| 07/07/2025 07/07/25 | Price Changed | $274,900 | -3.5% | $279 / Sq Ft |
| 05/30/2025 05/30/25 | For Sale | $284,900 | -- | $290 / Sq Ft |
Purchase History
| Date | Type | Sale Price | Title Company |
|---|---|---|---|
| Deed | $65,000 | None Listed On Document | |
| Deed | $65,000 | None Listed On Document |
Source: MLS of Greater Cincinnati (CincyMLS)
MLS Number: 1842648
APN: 671-0007-0381
Disclaimer: Certain information contained herein is derived from information provided by parties other than Homes.com. All information provided is deemed reliable, but is not guaranteed to be accurate and should be independently verified.
![]() The data relating to real estate for sale on this website comes in part from the Broker Reciprocity programs of the MLS of Greater Cincinnati, Inc.. Those listings held by brokerage firms other than Ten-X are marked with the Broker Reciprocity logo and house icon. The properties displayed may not be all of the properties available through Broker Reciprocity.
The data relating to real estate for sale on this website comes in part from the Broker Reciprocity programs of the MLS of Greater Cincinnati, Inc.. Those listings held by brokerage firms other than Ten-X are marked with the Broker Reciprocity logo and house icon. The properties displayed may not be all of the properties available through Broker Reciprocity.
IDX information is provided exclusively for personal, non-commercial use, and may not be used for any purpose other than to identify prospective properties consumers may be interested in purchasing.
Information is deemed reliable but not guaranteed.
Ten-X does not display the entire Cincinnati MLS Broker Reciprocity™ database on this web site. The listings of some real estate brokerage firms have been excluded.
Copyright 2025, MLS of Greater Cincinnati, Inc. All rights reserved
- 0 Hill St Unit 1616370
- 17 Maple St
- 8745 Reading Rd
- 310 E Vine St
- 1013 Market St
- 116 Pike St
- 653 Harmes Ave
- 327 Cooper St
- 636 Maple Dr
- 134 Walnut St
- 122 Gebert St
- 2558 Apple Ridge Ln
- 796 Kenray Ct
- 1521 Hunt Rd
- 2132 Trailridge Dr
- 20 Clark Rd
- 1421 Jefferson Ave
- 69 Orchard Knoll Dr
- 415 Arlington Ave
- 9 W North St
- 145 W Benson St Unit 1
- 228 Pike St Unit ID1014424P
- 228 Pike St Unit ID1036068P
- 228 Pike St Unit ID1036067P
- 228 Pike St Unit ID1036070P
- 228 Pike St Unit ID1014457P
- 228 Pike St Unit ID1014428P
- 85 Aljoy Ct
- 1 E Lake Shore Dr
- 1719 Hunt Rd
- 40 S Terrace Dr
- 64 Gahl Terrace
- 516 Olden Ave Unit 1
- 512 Olden Ave Unit 2
- 300-400 Hillside Ave
- 405 Mcewing Dr
- 631 Mulberry St
- 7848 Glenorchard Dr Unit A
- 7844 Glenorchard Dr Unit B
- 344 Ridgeway Rd Unit 1