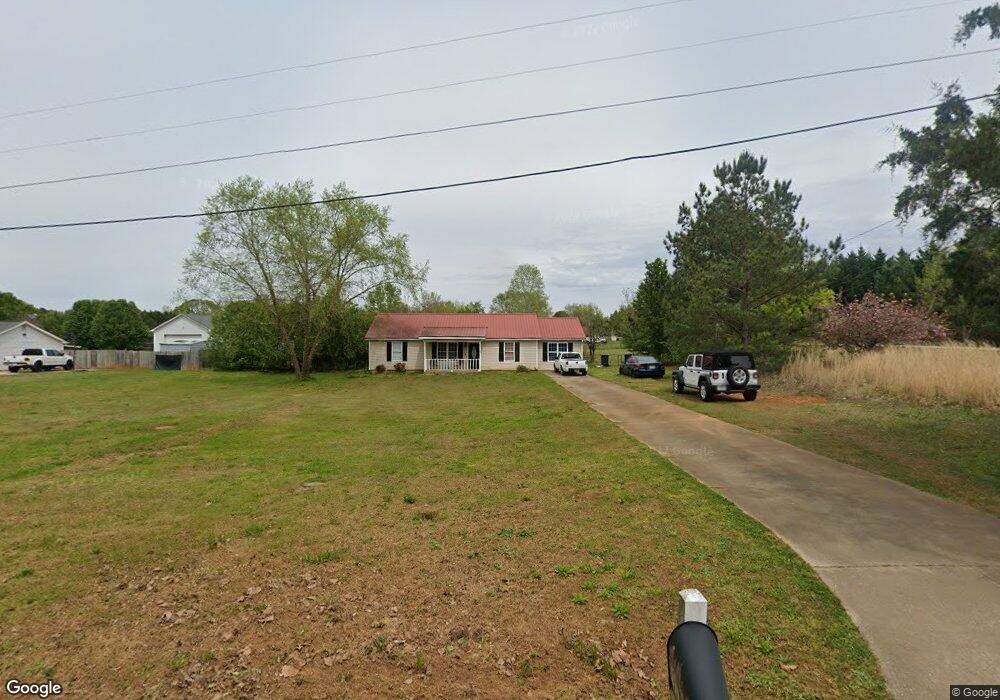
797 S Laney Rd Unit 1.3AC Locust Grove, GA 30248
Estimated Value: $249,000 - $263,539
3
Beds
2
Baths
1,382
Sq Ft
$186/Sq Ft
Est. Value
About This Home
This home is located at 797 S Laney Rd Unit 1.3AC, Locust Grove, GA 30248 and is currently estimated at $257,385, approximately $186 per square foot. 797 S Laney Rd Unit 1.3AC is a home located in Henry County with nearby schools including New Hope Elementary School, Locust Grove Middle School, and Locust Grove High School.
Ownership History
Date
Name
Owned For
Owner Type
Purchase Details
Closed on
Dec 21, 2015
Sold by
Lunsford House Properties Llc
Bought by
Bowen Ashley
Current Estimated Value
Home Financials for this Owner
Home Financials are based on the most recent Mortgage that was taken out on this home.
Original Mortgage
$98,188
Outstanding Balance
$78,675
Interest Rate
3.87%
Mortgage Type
FHA
Estimated Equity
$178,710
Purchase Details
Closed on
Jun 29, 2015
Sold by
Federal National Mortgage Association
Bought by
Lunsford House Properties Llc
Purchase Details
Closed on
Feb 3, 2015
Sold by
Sisk Andrew M
Bought by
Jpmorgan Chase Bank National A
Purchase Details
Closed on
Feb 14, 2000
Sold by
Smith Tamara R
Bought by
Sisk Andrew M and Sisk Alycia C
Home Financials for this Owner
Home Financials are based on the most recent Mortgage that was taken out on this home.
Original Mortgage
$75,900
Interest Rate
8.17%
Mortgage Type
New Conventional
Create a Home Valuation Report for This Property
The Home Valuation Report is an in-depth analysis detailing your home's value as well as a comparison with similar homes in the area
Home Values in the Area
Average Home Value in this Area
Purchase History
| Date | Buyer | Sale Price | Title Company |
|---|---|---|---|
| Bowen Ashley | $100,000 | -- | |
| Lunsford House Properties Llc | $64,000 | -- | |
| Jpmorgan Chase Bank National A | $80,261 | -- | |
| Federal National Mtg Associati | $80,261 | -- | |
| Sisk Andrew M | $79,900 | -- |
Source: Public Records
Mortgage History
| Date | Status | Borrower | Loan Amount |
|---|---|---|---|
| Open | Bowen Ashley | $98,188 | |
| Previous Owner | Sisk Andrew M | $75,900 |
Source: Public Records
Tax History Compared to Growth
Tax History
| Year | Tax Paid | Tax Assessment Tax Assessment Total Assessment is a certain percentage of the fair market value that is determined by local assessors to be the total taxable value of land and additions on the property. | Land | Improvement |
|---|---|---|---|---|
| 2025 | $4,031 | $100,960 | $15,840 | $85,120 |
| 2024 | $4,031 | $102,360 | $14,320 | $88,040 |
| 2023 | $3,772 | $97,280 | $13,800 | $83,480 |
| 2022 | $3,017 | $77,600 | $12,720 | $64,880 |
| 2021 | $2,464 | $63,200 | $10,920 | $52,280 |
| 2020 | $2,179 | $55,760 | $10,280 | $45,480 |
| 2019 | $2,051 | $52,440 | $9,760 | $42,680 |
| 2018 | $1,867 | $47,640 | $9,000 | $38,640 |
| 2016 | $1,533 | $38,920 | $6,840 | $32,080 |
| 2015 | $1,085 | $33,720 | $7,360 | $26,360 |
| 2014 | -- | $23,240 | $7,360 | $15,880 |
Source: Public Records
Map
Nearby Homes
- S S Laney Rd
- 690 Laney Rd
- 376 Cattlemans Cir
- 976 S Laney Rd
- 125 Karen Dr
- 125 Laney Ct
- 100 Harbin Trail
- 888 Laney Rd
- 175 Laney Ct Unit 1
- 215 Laney Rd
- 328 Cattlemans Cir
- 1126 Old Jackson Rd
- 121 Ducati Dr
- 225 Laney Ct
- 0 S Ola Rd Unit 10563258
- 995 Old Jackson Rd
- 732 New Hope Rd
- 281 Laney Dr
- 813 S Ola Rd
- 121, 125, 129 Case Dr
- 797 S Laney Rd
- S S Laney Rd Unit 1.3AC
- 767 S Laney Rd
- 817 S Laney Rd
- 101 Cedar Ridge Rd
- 747 S Laney Rd
- 748 S Laney Rd
- 768 S Laney Rd
- 737 S Laney Rd
- 825 S Laney Rd
- 100 Cedar Ridge Rd
- 105 Cedar Ridge Rd
- 758 S Laney Rd
- 814 S Laney Rd
- 620 Laney Rd
- 723 S Laney Rd
- 104 Cedar Ridge Rd
- 948 S Laney Rd
- 952 S Laney Rd
- 956 S Laney Rd