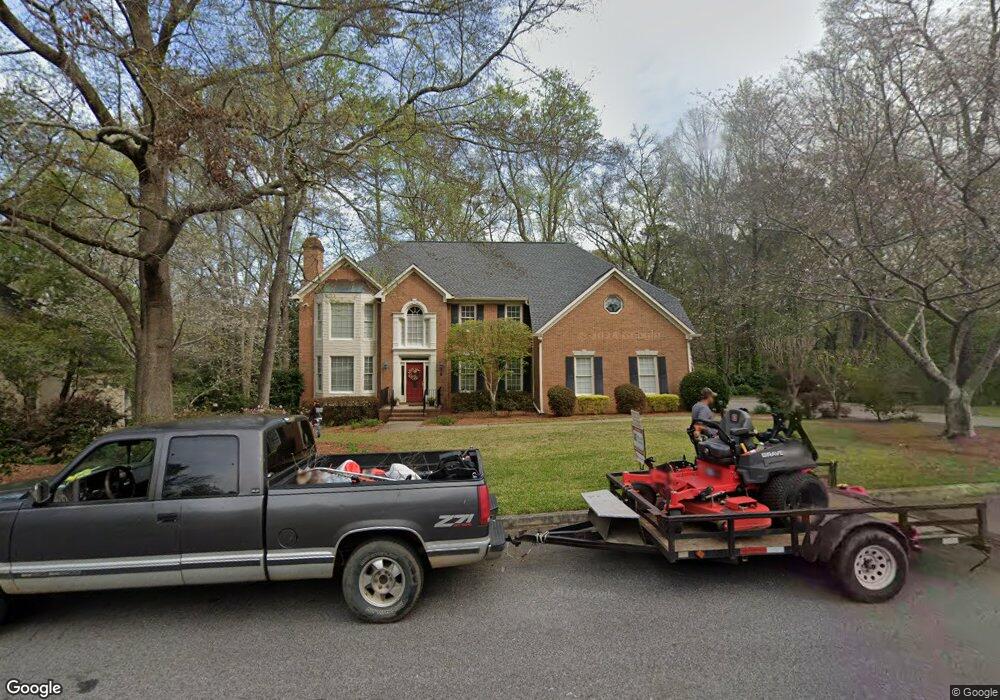
797 Saint Andrews Dr Macon, GA 31210
Estimated Value: $623,000 - $687,000
4
Beds
4
Baths
3,832
Sq Ft
$171/Sq Ft
Est. Value
About This Home
This home is located at 797 Saint Andrews Dr, Macon, GA 31210 and is currently estimated at $653,774, approximately $170 per square foot. 797 Saint Andrews Dr is a home located in Bibb County with nearby schools including Carter Elementary School, Howard Middle School, and Howard High School.
Ownership History
Date
Name
Owned For
Owner Type
Purchase Details
Closed on
Jun 13, 2022
Sold by
Anderson Ballard Tindal
Bought by
Ballard Tindal Anderson and Ballard Raymond Odell
Current Estimated Value
Home Financials for this Owner
Home Financials are based on the most recent Mortgage that was taken out on this home.
Original Mortgage
$493,000
Interest Rate
5.27%
Mortgage Type
New Conventional
Purchase Details
Closed on
May 6, 2022
Sold by
Dunn Family Trust
Bought by
Anderson Emily Tindal
Home Financials for this Owner
Home Financials are based on the most recent Mortgage that was taken out on this home.
Original Mortgage
$493,000
Interest Rate
5.27%
Mortgage Type
New Conventional
Purchase Details
Closed on
Apr 9, 2010
Sold by
Dunn Charles F
Bought by
Dunn Charles F and Dunn Carol W
Purchase Details
Closed on
Mar 1, 2000
Bought by
Dunn Charles F & Carol W Tr
Create a Home Valuation Report for This Property
The Home Valuation Report is an in-depth analysis detailing your home's value as well as a comparison with similar homes in the area
Home Values in the Area
Average Home Value in this Area
Purchase History
| Date | Buyer | Sale Price | Title Company |
|---|---|---|---|
| Ballard Tindal Anderson | -- | None Listed On Document | |
| Anderson Emily Tindal | $519,000 | Smith Hawkins Hollingsworth & | |
| Dunn Charles F | -- | None Available | |
| Dunn Charles F | -- | None Available | |
| Dunn Charles F & Carol W Tr | $267,500 | -- |
Source: Public Records
Mortgage History
| Date | Status | Borrower | Loan Amount |
|---|---|---|---|
| Previous Owner | Anderson Emily Tindal | $493,000 |
Source: Public Records
Tax History Compared to Growth
Tax History
| Year | Tax Paid | Tax Assessment Tax Assessment Total Assessment is a certain percentage of the fair market value that is determined by local assessors to be the total taxable value of land and additions on the property. | Land | Improvement |
|---|---|---|---|---|
| 2025 | $5,401 | $219,785 | $40,320 | $179,465 |
| 2024 | $5,582 | $219,785 | $40,320 | $179,465 |
| 2023 | $5,186 | $204,180 | $40,320 | $163,860 |
| 2022 | $6,388 | $191,515 | $28,800 | $162,715 |
| 2021 | $6,599 | $180,668 | $28,800 | $151,868 |
| 2020 | $6,193 | $166,506 | $24,000 | $142,506 |
| 2019 | $5,699 | $152,576 | $24,000 | $128,576 |
| 2018 | $8,907 | $152,576 | $24,000 | $128,576 |
| 2017 | $4,972 | $139,719 | $24,000 | $115,719 |
| 2016 | $4,592 | $139,719 | $24,000 | $115,719 |
| 2015 | $6,489 | $139,719 | $24,000 | $115,719 |
| 2014 | $6,489 | $139,719 | $24,000 | $115,719 |
Source: Public Records
Map
Nearby Homes
- 4532 Ayers Rd
- 117 Legare Ct
- 4571 Shadow Lawn Dr
- 4373 Barrington Place
- 3949 Bernice Ave
- 4403 Azalea Dr
- 4433 Azalea Dr
- 1402 Barrington Place
- 1406 Barrington Place
- 534 Ivy Brook Way
- 776 Ivy Brook Way
- 740 Ivy Brook Way
- 621 Ivy Brook Way
- 1183 Saint Andrews Dr
- 631 Ivy Brook Way
- 715 Ivy Brook Way
- 2006 Fall Harvest Dr Unit LOT 278
- 2006 Fall Harvest Dr
- 2002 Fall Harvest Dr
- 2008 Fall Harvest Dr Unit LOT 277
- 797 St Andrews Dr
- 801 Saint Andrews Dr
- 4664 Carnoustie Ct
- 794 Saint Andrews Dr
- 811 St Andrews Dr Dr
- 811 Saint Andrews Dr
- 790 Saint Andrews Dr
- 4626 Saint Anne Ct
- 810 Saint Andrews Dr
- 835 Saint Andrews Dr
- 841 Saint Andrews Dr
- 841 St Andrews Dr
- 786 Saint Andrews Dr
- 4670 Carnoustie Ct
- 4652 Brae Burn Ln
- 850 Saint Andrews Dr
- 777 Saint Andrews Dr
- 4636 Brae Burn Ln
- 4770 Ayers Rd
- 103 Turnberry Park