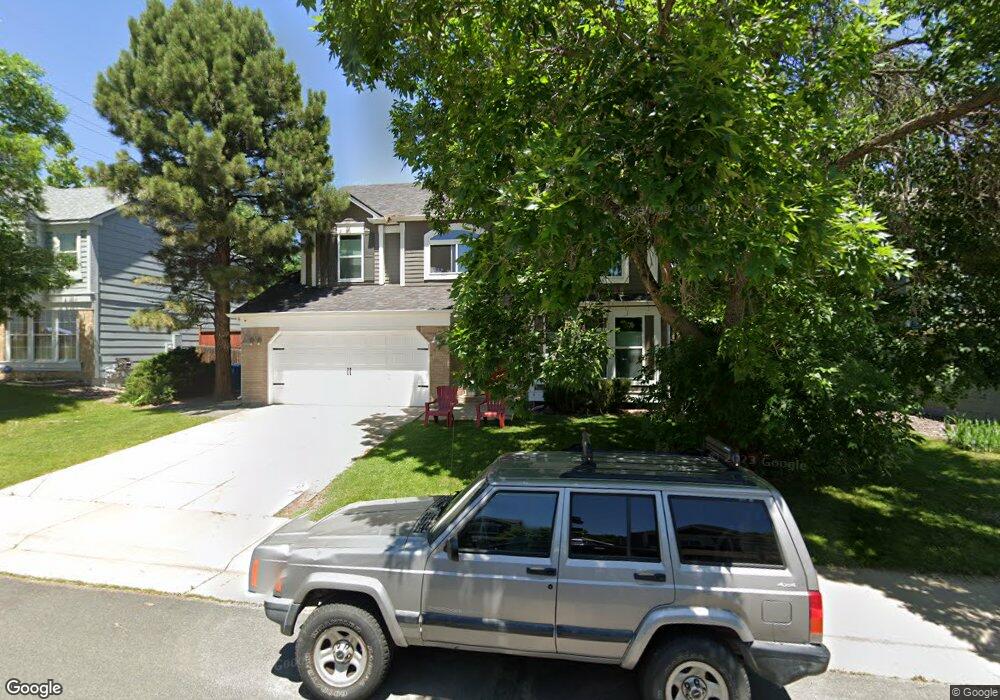
797 W Pinyon Way Louisville, CO 80027
Estimated Value: $973,000 - $1,112,000
5
Beds
4
Baths
3,194
Sq Ft
$329/Sq Ft
Est. Value
About This Home
This home is located at 797 W Pinyon Way, Louisville, CO 80027 and is currently estimated at $1,051,445, approximately $329 per square foot. 797 W Pinyon Way is a home located in Boulder County with nearby schools including Fireside Elementary School, Monarch K-8 School, and Monarch High School.
Ownership History
Date
Name
Owned For
Owner Type
Purchase Details
Closed on
May 10, 2016
Sold by
Colacci Sutera Sally J
Bought by
Cross Ginger Marie
Current Estimated Value
Home Financials for this Owner
Home Financials are based on the most recent Mortgage that was taken out on this home.
Original Mortgage
$417,000
Outstanding Balance
$331,093
Interest Rate
3.58%
Mortgage Type
New Conventional
Estimated Equity
$720,352
Purchase Details
Closed on
Jun 1, 1998
Sold by
Colaccisutera Sally J and Colaccisutera Sally J
Bought by
Colacci Sutera Sally J
Home Financials for this Owner
Home Financials are based on the most recent Mortgage that was taken out on this home.
Original Mortgage
$174,750
Interest Rate
7.2%
Purchase Details
Closed on
Aug 18, 1993
Bought by
Cross Ginger Marie and Cross Eric Alois
Purchase Details
Closed on
Jul 26, 1988
Bought by
Cross Ginger Marie and Cross Eric Alois
Purchase Details
Closed on
Apr 5, 1988
Bought by
Cross Ginger Marie and Cross Eric Alois
Create a Home Valuation Report for This Property
The Home Valuation Report is an in-depth analysis detailing your home's value as well as a comparison with similar homes in the area
Home Values in the Area
Average Home Value in this Area
Purchase History
| Date | Buyer | Sale Price | Title Company |
|---|---|---|---|
| Cross Ginger Marie | $575,000 | Heritage Title Company | |
| Colacci Sutera Sally J | -- | -- | |
| Cross Ginger Marie | -- | -- | |
| Cross Ginger Marie | $132,000 | -- | |
| Cross Ginger Marie | $21,500 | -- |
Source: Public Records
Mortgage History
| Date | Status | Borrower | Loan Amount |
|---|---|---|---|
| Open | Cross Ginger Marie | $417,000 | |
| Previous Owner | Colacci Sutera Sally J | $174,750 |
Source: Public Records
Tax History Compared to Growth
Tax History
| Year | Tax Paid | Tax Assessment Tax Assessment Total Assessment is a certain percentage of the fair market value that is determined by local assessors to be the total taxable value of land and additions on the property. | Land | Improvement |
|---|---|---|---|---|
| 2025 | $5,951 | $67,550 | $23,606 | $43,944 |
| 2024 | $5,951 | $67,550 | $23,606 | $43,944 |
| 2023 | $5,850 | $66,209 | $25,594 | $44,300 |
| 2022 | $4,600 | $47,795 | $17,973 | $29,822 |
| 2021 | $5,175 | $55,877 | $21,014 | $34,863 |
| 2020 | $4,626 | $49,436 | $17,661 | $31,775 |
| 2019 | $4,561 | $49,436 | $17,661 | $31,775 |
| 2018 | $4,020 | $45,000 | $8,856 | $36,144 |
| 2017 | $3,940 | $49,750 | $9,791 | $39,959 |
| 2016 | $3,474 | $39,490 | $13,373 | $26,117 |
| 2015 | $3,293 | $30,168 | $16,477 | $13,691 |
| 2014 | $2,579 | $30,168 | $16,477 | $13,691 |
Source: Public Records
Map
Nearby Homes
- 494 Owl Dr Unit 4
- 118 S Tanager Ct
- 812 W Mulberry St
- 408 Fillmore Ct
- 810 Trail Ridge Dr
- 823 Trail Ridge Dr
- 159 S Polk Ave
- 848 Trail Ridge Dr
- 900 Eldorado Ln
- 592 Spruce Cir
- 641 W Dahlia St
- 593 Wildrose Way
- 174 Cherrywood Ln
- 279 S Taft Ct Unit 53
- 958 Eldorado Ln
- 955 Arapahoe Cir
- 323 S Taft Ct Unit 26
- 305 S Taft Ct Unit 33
- 284 S Taft Ct Unit 76
- 1006 Honeysuckle Ln
- 799 W Pinyon Way
- 795 W Pinyon Way
- 706 Nighthawk Cir
- 793 W Pinyon Way
- 710 Nighthawk Cir
- 792 W Pinyon Way
- 790 W Pinyon Way
- 794 W Pinyon Way
- 702 Nighthawk Cir
- 714 Nighthawk Cir
- 758 Owl Dr
- 780 W Hemlock Cir
- 718 Nighthawk Cir
- 782 W Hemlock Cir
- 776 W Hemlock Cir
- 740 Owl Dr
- 701 Nighthawk Cir
- 707 Nighthawk Cir
- 722 Nighthawk Cir
- 402 Owl Dr Unit 53