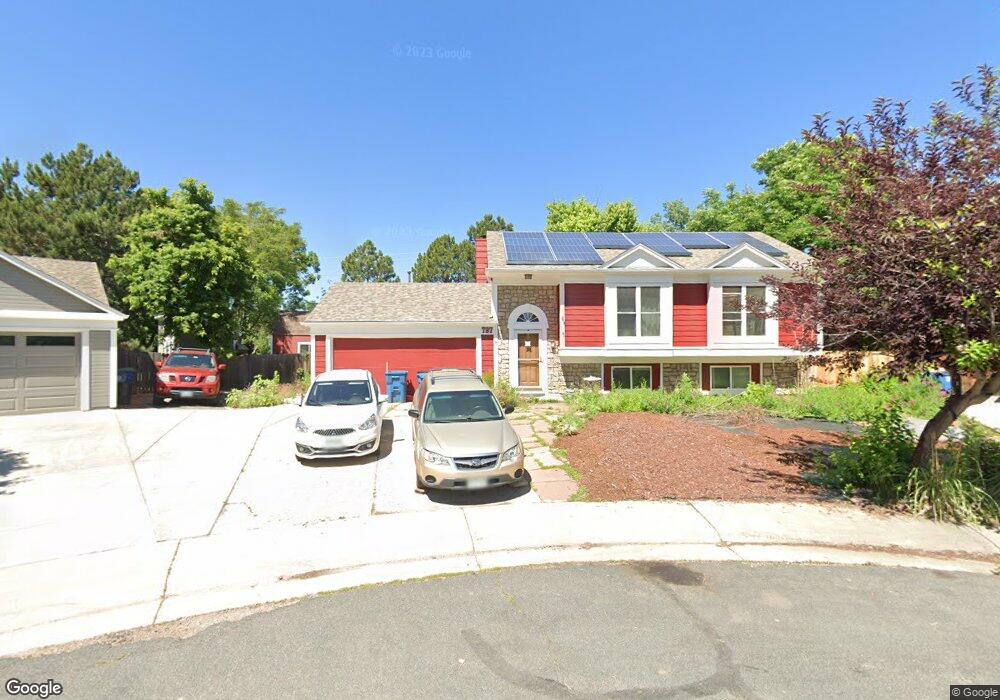
797 W Raintree Ct Louisville, CO 80027
Estimated Value: $709,772 - $788,000
4
Beds
2
Baths
1,872
Sq Ft
$406/Sq Ft
Est. Value
About This Home
This home is located at 797 W Raintree Ct, Louisville, CO 80027 and is currently estimated at $760,193, approximately $406 per square foot. 797 W Raintree Ct is a home located in Boulder County with nearby schools including Fireside Elementary School, Monarch K-8 School, and Monarch High School.
Ownership History
Date
Name
Owned For
Owner Type
Purchase Details
Closed on
Mar 3, 2010
Sold by
Croteau Kevin M
Bought by
Croteau Kevin M
Current Estimated Value
Home Financials for this Owner
Home Financials are based on the most recent Mortgage that was taken out on this home.
Original Mortgage
$286,121
Outstanding Balance
$194,496
Interest Rate
5.5%
Mortgage Type
FHA
Estimated Equity
$565,697
Purchase Details
Closed on
Aug 29, 1995
Sold by
Thomsen Cynthia J
Bought by
Rens Kevin L
Home Financials for this Owner
Home Financials are based on the most recent Mortgage that was taken out on this home.
Original Mortgage
$100,100
Interest Rate
7.6%
Purchase Details
Closed on
Oct 9, 1992
Bought by
Croteau Kevin M and Croteau Ann Marie
Purchase Details
Closed on
May 4, 1992
Bought by
Croteau Kevin M and Croteau Ann Marie
Purchase Details
Closed on
Jun 6, 1983
Bought by
Croteau Kevin M and Croteau Ann Marie
Create a Home Valuation Report for This Property
The Home Valuation Report is an in-depth analysis detailing your home's value as well as a comparison with similar homes in the area
Home Values in the Area
Average Home Value in this Area
Purchase History
| Date | Buyer | Sale Price | Title Company |
|---|---|---|---|
| Croteau Kevin M | -- | Chicago Title Co | |
| Rens Kevin L | $177,900 | -- | |
| Croteau Kevin M | -- | -- | |
| Croteau Kevin M | -- | -- | |
| Croteau Kevin M | $85,200 | -- |
Source: Public Records
Mortgage History
| Date | Status | Borrower | Loan Amount |
|---|---|---|---|
| Open | Croteau Kevin M | $286,121 | |
| Previous Owner | Rens Kevin L | $100,100 |
Source: Public Records
Tax History Compared to Growth
Tax History
| Year | Tax Paid | Tax Assessment Tax Assessment Total Assessment is a certain percentage of the fair market value that is determined by local assessors to be the total taxable value of land and additions on the property. | Land | Improvement |
|---|---|---|---|---|
| 2025 | $4,380 | $49,762 | $26,881 | $22,881 |
| 2024 | $4,380 | $49,762 | $26,881 | $22,881 |
| 2023 | $4,306 | $48,736 | $28,462 | $23,959 |
| 2022 | $3,673 | $38,169 | $20,690 | $17,479 |
| 2021 | $3,953 | $42,685 | $23,137 | $19,548 |
| 2020 | $3,572 | $38,174 | $19,377 | $18,797 |
| 2019 | $3,522 | $38,174 | $19,377 | $18,797 |
| 2018 | $2,789 | $31,219 | $13,032 | $18,187 |
| 2017 | $2,734 | $34,515 | $14,408 | $20,107 |
| 2016 | $2,740 | $31,147 | $15,681 | $15,466 |
| 2015 | $2,597 | $27,239 | $14,965 | $12,274 |
| 2014 | $2,329 | $27,239 | $14,965 | $12,274 |
Source: Public Records
Map
Nearby Homes
- 279 S Taft Ct Unit 53
- 641 W Dahlia St
- 118 S Tanager Ct
- 323 S Taft Ct Unit 26
- 305 S Taft Ct Unit 33
- 284 S Taft Ct Unit 76
- 812 W Mulberry St
- 362 S Taft Ct Unit 108
- 159 S Polk Ave
- 749 Apple Ct
- 408 Fillmore Ct
- 494 Owl Dr Unit 4
- 900 Eldorado Ln
- 546 Ridgeview Dr
- 810 Trail Ridge Dr
- 539 Coal Creek Ln
- 1057 W Century Dr Unit 212
- 572 Ridgeview Dr
- 567 Manorwood Ln
- 592 Spruce Cir
- 781 W Raintree Ct
- 782 W Raintree Ct
- 786 W Fir Ct
- 769 W Raintree Ct
- 762 W Raintree Ct
- 778 W Fir Ct
- 799 W Dahlia St
- 787 W Dahlia St
- 743 W Raintree Ct
- 750 W Raintree Ct
- 766 W Fir Ct
- 746 W Fir Ct
- 737 W Raintree Ct
- 738 W Raintree Ct
- 751 W Dahlia St
- 773 W Fir Ct
- 739 W Dahlia St
- 730 W Fir Ct
- 795 W Fir Ct
- 725 W Raintree Ct