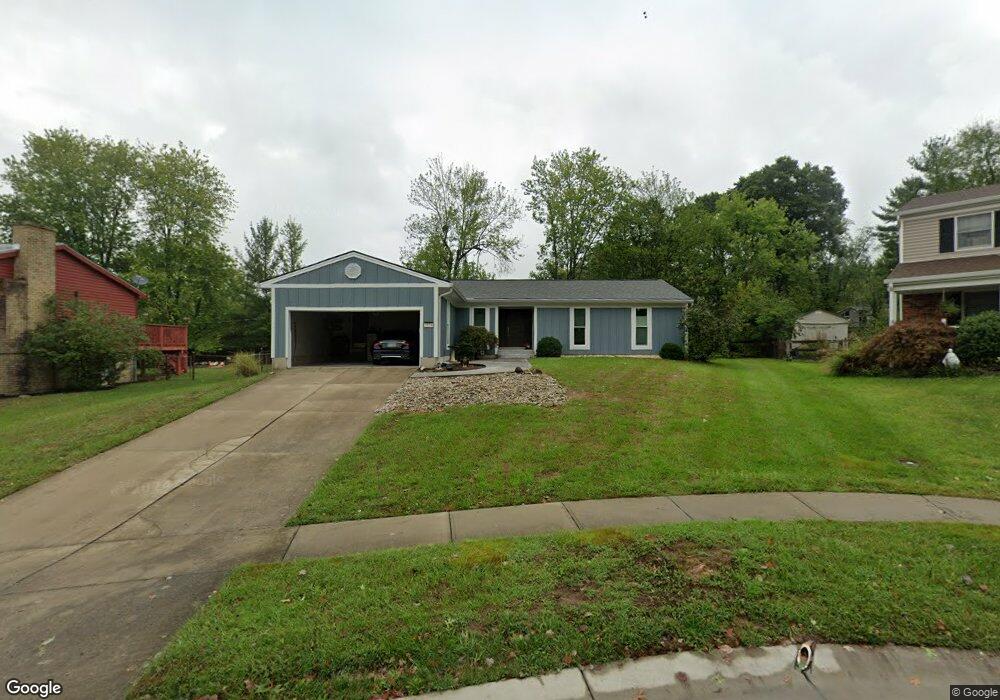
7974 Dunview Ct Cincinnati, OH 45255
Estimated Value: $321,000 - $384,000
3
Beds
2
Baths
1,600
Sq Ft
$213/Sq Ft
Est. Value
About This Home
This home is located at 7974 Dunview Ct, Cincinnati, OH 45255 and is currently estimated at $341,304, approximately $213 per square foot. 7974 Dunview Ct is a home located in Hamilton County with nearby schools including Wilson Elementary School, Nagel Middle School, and Turpin High School.
Ownership History
Date
Name
Owned For
Owner Type
Purchase Details
Closed on
Apr 6, 2015
Sold by
Ward Barbara J
Bought by
Ward Joel G and Clark Rachel J
Current Estimated Value
Purchase Details
Closed on
Feb 13, 2015
Sold by
Ward Barbara J
Bought by
Ward Barbara J
Purchase Details
Closed on
Dec 10, 2003
Sold by
Ward Barbara J
Bought by
Ward Barbara J
Purchase Details
Closed on
Oct 22, 2002
Sold by
Dudley John C and Dudley Amber N
Bought by
Ward Barbara J
Purchase Details
Closed on
May 27, 1998
Sold by
Cronin Michael D and Cronin Barbara G
Bought by
Dudley John C and Dudley Amber N
Home Financials for this Owner
Home Financials are based on the most recent Mortgage that was taken out on this home.
Original Mortgage
$104,400
Interest Rate
7.27%
Create a Home Valuation Report for This Property
The Home Valuation Report is an in-depth analysis detailing your home's value as well as a comparison with similar homes in the area
Home Values in the Area
Average Home Value in this Area
Purchase History
| Date | Buyer | Sale Price | Title Company |
|---|---|---|---|
| Ward Joel G | -- | Attorney | |
| Ward Barbara J | -- | Attorney | |
| Ward Barbara J | -- | -- | |
| Ward Barbara J | $150,000 | -- | |
| Dudley John C | $130,500 | -- |
Source: Public Records
Mortgage History
| Date | Status | Borrower | Loan Amount |
|---|---|---|---|
| Previous Owner | Dudley John C | $104,400 |
Source: Public Records
Tax History
| Year | Tax Paid | Tax Assessment Tax Assessment Total Assessment is a certain percentage of the fair market value that is determined by local assessors to be the total taxable value of land and additions on the property. | Land | Improvement |
|---|---|---|---|---|
| 2025 | $5,471 | $87,553 | $18,669 | $68,884 |
| 2023 | $5,057 | $87,553 | $18,669 | $68,884 |
| 2022 | $4,815 | $74,235 | $18,207 | $56,028 |
| 2021 | $4,701 | $74,235 | $18,207 | $56,028 |
| 2020 | $4,755 | $74,235 | $18,207 | $56,028 |
| 2019 | $4,293 | $60,848 | $14,924 | $45,924 |
| 2018 | $4,021 | $60,848 | $14,924 | $45,924 |
| 2017 | $3,792 | $60,848 | $14,924 | $45,924 |
| 2016 | $3,796 | $59,500 | $14,889 | $44,611 |
| 2015 | $3,686 | $59,500 | $14,889 | $44,611 |
| 2014 | $3,689 | $59,500 | $14,889 | $44,611 |
| 2013 | $3,420 | $58,335 | $14,599 | $43,736 |
Source: Public Records
Map
Nearby Homes
- 7926 Dunview Ct
- 1885 Wanninger Ln
- 1858 Foxhollow Dr
- 7660 Clough Pike
- 7652 Clough Pike
- 8022 Stonegate Dr
- 8146 Clough Pike
- 1363 Oak Ct
- 8096 Pineterrace Dr
- 1357 Oak Ct
- 1847 Eight Mile Rd
- 7712 Stonehill Dr
- 1400 Sigma Cir
- 1748 Hilltree Dr
- 8175 Timbercreek Dr
- 1662 Hilltree Dr
- 1747 Summithills Dr
- 1333 Eight Mile Rd
- 2256 Endovalley Dr
- 1251 Eight Mile Rd
- 7986 Dunview Ct
- 7962 Dunview Ct
- 7965 Heatherglen Dr
- 7977 Heatherglen Dr
- 7950 Dunview Ct
- 7998 Dunview Ct
- 7969 Dunview Ct
- 7953 Heatherglen Dr
- 7983 Dunview Ct
- 7938 Dunview Ct
- 7957 Dunview Ct
- 1727 Nagel Rd
- 1715 Nagel Rd
- 1757 Nagel Rd
- 7945 Dunview Ct
- 7941 Heatherglen Dr
- 7966 Heatherglen Dr
- 1705 Nagel Rd
- 7927 Heatherglen Dr
- 7954 Heatherglen Dr
Your Personal Tour Guide
Ask me questions while you tour the home.