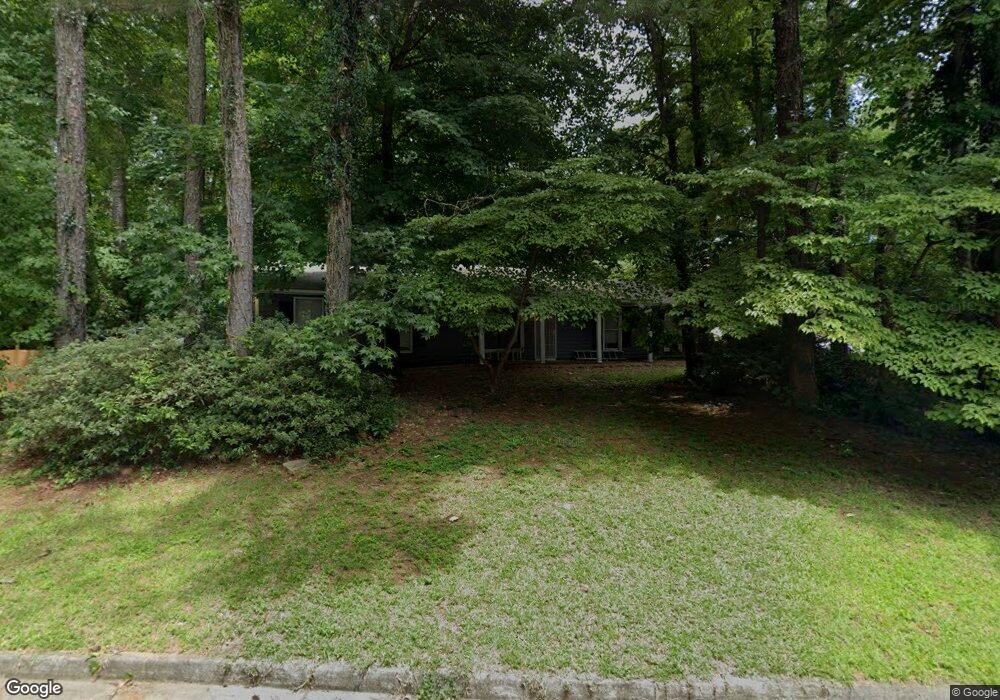
7978 Northcrest Dr Jonesboro, GA 30238
Estimated Value: $198,000 - $220,000
3
Beds
2
Baths
1,260
Sq Ft
$164/Sq Ft
Est. Value
About This Home
This home is located at 7978 Northcrest Dr, Jonesboro, GA 30238 and is currently estimated at $207,144, approximately $164 per square foot. 7978 Northcrest Dr is a home located in Clayton County with nearby schools including Swint Elementary School, Pointe South Middle School, and Mundy's Mill High School.
Ownership History
Date
Name
Owned For
Owner Type
Purchase Details
Closed on
Dec 13, 2019
Sold by
Triangle Sfr Llc
Bought by
Crowne Property Acquisitions Llc
Current Estimated Value
Purchase Details
Closed on
Dec 9, 2019
Sold by
Floyd Real Estate Properties Llc
Bought by
Triangle Sfr Llc
Purchase Details
Closed on
Mar 29, 2017
Sold by
Harvest Assets Llc
Bought by
Winebrenner Victor M and Winebrenner Claudia J
Purchase Details
Closed on
Mar 28, 2017
Sold by
Winebrenner Victor M
Bought by
Floyd Real Estate Properties L
Purchase Details
Closed on
Mar 1, 2016
Sold by
Winebrenner Victor M
Bought by
Harvest Assets Llc
Purchase Details
Closed on
Feb 27, 1998
Sold by
Taylor John R and Taylor Virginia A
Bought by
Winebrenner Victor M
Home Financials for this Owner
Home Financials are based on the most recent Mortgage that was taken out on this home.
Original Mortgage
$74,955
Interest Rate
6.95%
Mortgage Type
New Conventional
Create a Home Valuation Report for This Property
The Home Valuation Report is an in-depth analysis detailing your home's value as well as a comparison with similar homes in the area
Home Values in the Area
Average Home Value in this Area
Purchase History
| Date | Buyer | Sale Price | Title Company |
|---|---|---|---|
| Crowne Property Acquisitions Llc | $110,925 | -- | |
| Triangle Sfr Llc | $92,500 | -- | |
| Winebrenner Victor M | $22,901 | -- | |
| Floyd Real Estate Properties L | $29,000 | -- | |
| Harvest Assets Llc | $16,500 | -- | |
| Winebrenner Victor M | $78,900 | -- |
Source: Public Records
Mortgage History
| Date | Status | Borrower | Loan Amount |
|---|---|---|---|
| Previous Owner | Winebrenner Victor M | $74,955 |
Source: Public Records
Tax History Compared to Growth
Tax History
| Year | Tax Paid | Tax Assessment Tax Assessment Total Assessment is a certain percentage of the fair market value that is determined by local assessors to be the total taxable value of land and additions on the property. | Land | Improvement |
|---|---|---|---|---|
| 2024 | $3,995 | $101,520 | $7,200 | $94,320 |
| 2023 | $3,487 | $95,600 | $7,200 | $88,400 |
| 2022 | $3,068 | $77,280 | $7,200 | $70,080 |
| 2021 | $2,261 | $56,360 | $7,200 | $49,160 |
| 2020 | $1,810 | $44,370 | $7,200 | $37,170 |
| 2019 | $1,636 | $39,425 | $5,600 | $33,825 |
| 2018 | $1,221 | $29,214 | $5,600 | $23,614 |
| 2017 | $907 | $21,434 | $5,600 | $15,834 |
| 2016 | $841 | $19,804 | $5,600 | $14,204 |
| 2015 | $835 | $0 | $0 | $0 |
| 2014 | $905 | $21,886 | $5,600 | $16,286 |
Source: Public Records
Map
Nearby Homes
- 8919 Saddlewood Dr
- 714 Chatham Trail
- 8883 Peppertree Dr
- 815 Darlington Dr
- 616 Country Lane Dr
- 8949 Raven Dr Unit I
- 593 Country Lane Dr
- 9043 Raven Dr
- 8882 Habersham Dr
- 8737 Edenton Way Unit 1
- 638 Wellington Way
- 8971 Habersham Dr Unit 2
- 542 Wellington Way
- 578 Wellington Way
- 529 Westminster Ln
- 553 Wellington Way
- 655 Raven Ct
- 8685 Woodside Ln
- 7978 Northcrest Dr
- 8850 Raven Dr Unit 2
- 8854 Raven Dr Unit 2
- 7973 Northcrest Dr
- 7981 Northcrest Dr Unit 2
- 7981 Northcrest Dr
- 8851 Raven Dr
- 7989 Northcrest Dr
- 8858 Raven Dr Unit 1
- 8893 Saddlewood Dr
- 7997 Northcrest Dr
- 8006 Northcrest Dr
- 8862 Raven Dr
- 9051 Gardener Dr
- 9055 Gardener Dr
- 8903 Saddlewood Dr Unit 1
- 9047 Gardener Dr
- 9059 Gardener Dr
- 8014 Northcrest Dr
- 8014 Northcrest Dr