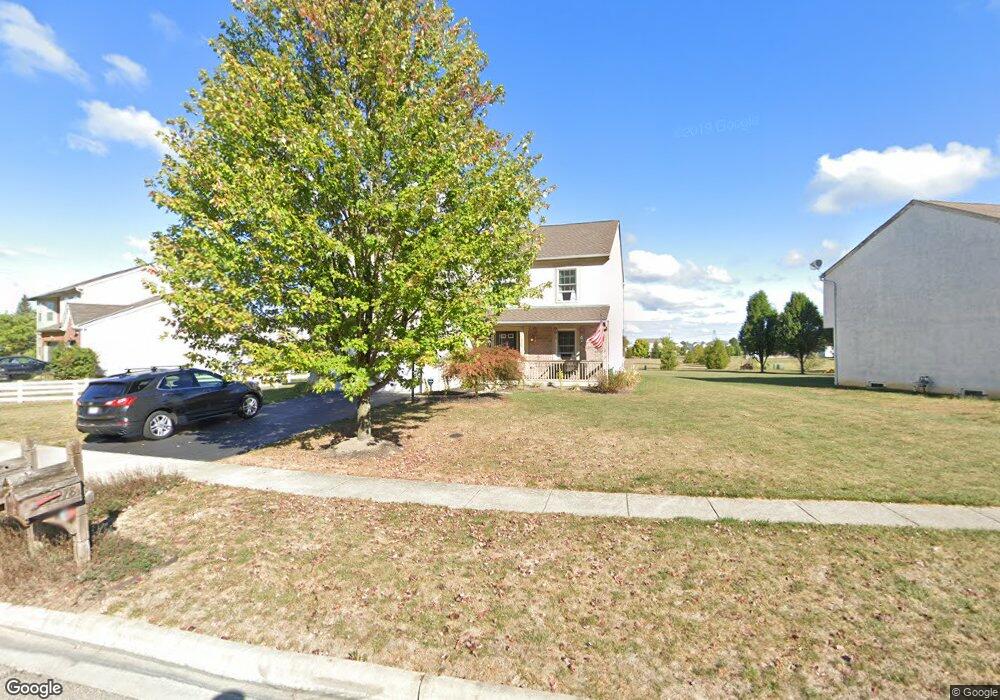
7978 Orange Station Loop Lewis Center, OH 43035
Orange NeighborhoodEstimated Value: $557,000 - $610,000
5
Beds
4
Baths
4,004
Sq Ft
$144/Sq Ft
Est. Value
About This Home
This home is located at 7978 Orange Station Loop, Lewis Center, OH 43035 and is currently estimated at $575,020, approximately $143 per square foot. 7978 Orange Station Loop is a home located in Delaware County with nearby schools including Glen Oak Elementary School, Olentangy Orange Middle School, and Orange High School.
Ownership History
Date
Name
Owned For
Owner Type
Purchase Details
Closed on
Oct 17, 2024
Sold by
Anderson Joshua P and Anderson Errin A
Bought by
Duong Anh Quyen and Pham Tran Thi
Current Estimated Value
Home Financials for this Owner
Home Financials are based on the most recent Mortgage that was taken out on this home.
Original Mortgage
$415,800
Outstanding Balance
$411,303
Interest Rate
6.2%
Mortgage Type
New Conventional
Estimated Equity
$163,717
Purchase Details
Closed on
Jul 26, 2005
Sold by
Maronda Homes Inc
Bought by
Anderson Joshua P and Anderson Errin A
Home Financials for this Owner
Home Financials are based on the most recent Mortgage that was taken out on this home.
Original Mortgage
$237,205
Interest Rate
5.71%
Mortgage Type
FHA
Create a Home Valuation Report for This Property
The Home Valuation Report is an in-depth analysis detailing your home's value as well as a comparison with similar homes in the area
Home Values in the Area
Average Home Value in this Area
Purchase History
| Date | Buyer | Sale Price | Title Company |
|---|---|---|---|
| Duong Anh Quyen | -- | Cbus Title Agency Llc | |
| Anderson Joshua P | $239,800 | Stewart Title |
Source: Public Records
Mortgage History
| Date | Status | Borrower | Loan Amount |
|---|---|---|---|
| Open | Duong Anh Quyen | $415,800 | |
| Previous Owner | Anderson Joshua P | $237,205 | |
| Closed | Anderson Joshua P | $44,350 |
Source: Public Records
Tax History Compared to Growth
Tax History
| Year | Tax Paid | Tax Assessment Tax Assessment Total Assessment is a certain percentage of the fair market value that is determined by local assessors to be the total taxable value of land and additions on the property. | Land | Improvement |
|---|---|---|---|---|
| 2024 | $9,131 | $164,930 | $34,340 | $130,590 |
| 2023 | $9,165 | $164,930 | $34,340 | $130,590 |
| 2022 | $7,589 | $110,990 | $24,500 | $86,490 |
| 2021 | $7,659 | $110,990 | $24,500 | $86,490 |
| 2020 | $7,696 | $110,990 | $24,500 | $86,490 |
| 2019 | $5,860 | $87,400 | $19,290 | $68,110 |
| 2018 | $5,886 | $87,400 | $19,290 | $68,110 |
| 2017 | $5,826 | $76,200 | $14,980 | $61,220 |
| 2016 | $5,470 | $76,200 | $14,980 | $61,220 |
| 2015 | $5,135 | $76,200 | $14,980 | $61,220 |
| 2014 | $5,067 | $76,200 | $14,980 | $61,220 |
| 2013 | $4,950 | $72,730 | $14,980 | $57,750 |
Source: Public Records
Map
Nearby Homes
- 1326 Westwood Dr
- 7742 Holderman St
- 810 Mystic Pointe Dr
- 789 Hidden Springs Dr
- 7633 Storrington Place
- 1143 Little Bear Place
- 1955 Royal Oak Dr
- 8268 Coppertop Ln
- 0 E Orange Rd Unit lot 1
- 0 E Orange Rd
- 1719 Impatiens Way
- 1923 Myrtle St
- 2165 Ben Brush Place
- 1811 Ivy St
- 8749 Paulden Ct
- 2216 Reeves Ave
- 1654 Sunflower St
- 2383 Bold Venture Dr
- 2347 Jaxton Ct
- 6964 Saint Ninians St
- 7956 Orange Station Loop
- 8008 Orange Station Loop
- 7934 Orange Station Loop
- 7934 Orange Station Loop Unit 5827
- 7910 Orange Station Loop
- 8056 Orange Station Loop
- 7993 Orange Station Loop
- 7969 Orange Station Loop
- 7894 Orange Station Loop
- 8074 Orange Station Loop
- 8005 Orange Station Loop
- 7957 Orange Station Loop
- 8092 Orange Station Loop
- 8092 Orange Station Loop Unit 6674
- 7880 Orange Station Loop
- 8019 Orange Station Loop
- 7933 Orange Station Loop
- 7921 Orange Station Loop
- 7921 Orange Station Loop Unit 5805
- 7945 Orange Station Loop