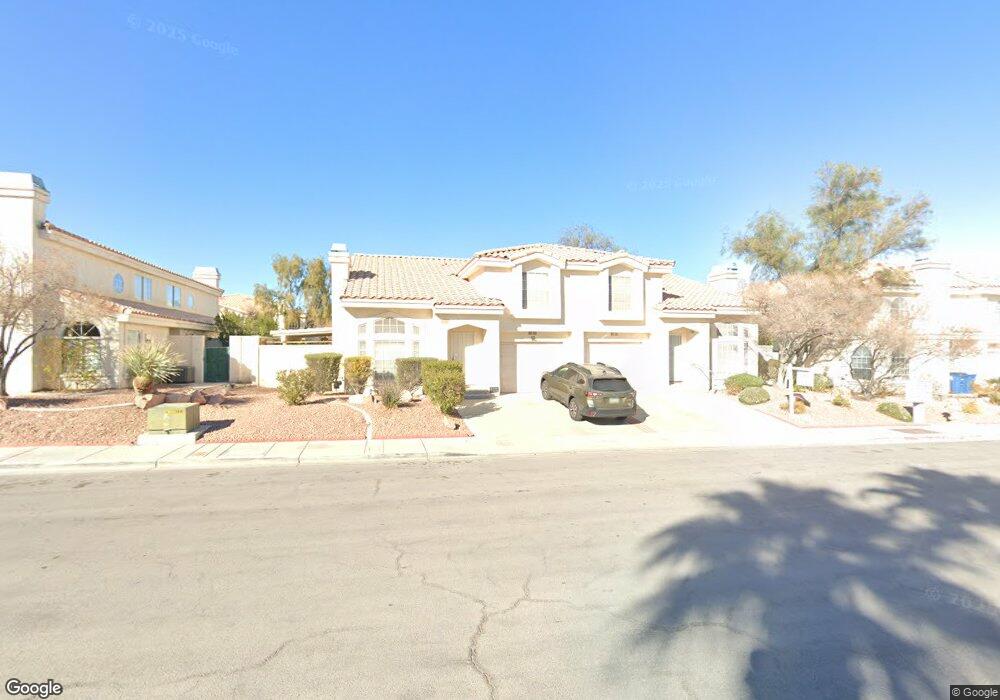
7978 W Nevso Dr Las Vegas, NV 89147
Rancho Viejo NeighborhoodEstimated Value: $319,000 - $336,000
2
Beds
3
Baths
1,287
Sq Ft
$255/Sq Ft
Est. Value
About This Home
This home is located at 7978 W Nevso Dr, Las Vegas, NV 89147 and is currently estimated at $328,248, approximately $255 per square foot. 7978 W Nevso Dr is a home located in Clark County with nearby schools including Roger M Bryan Elementary School, Clifford J Lawrence Junior High School, and Spring Valley High School.
Ownership History
Date
Name
Owned For
Owner Type
Purchase Details
Closed on
Nov 20, 2022
Sold by
Nguyen Binh Ngoc
Bought by
Binh Ngoc Nguyen Lv22 Trust
Current Estimated Value
Purchase Details
Closed on
Jan 22, 2020
Sold by
Bakelis Vicky
Bought by
Nguyen Binh Ngoc
Purchase Details
Closed on
Apr 28, 2014
Sold by
Schlembach Hans Christopher and Schlembach Christopher
Bought by
Bakelis Vicky
Purchase Details
Closed on
May 31, 2011
Sold by
Hoffman Robert E
Bought by
Schlembach Christopher
Purchase Details
Closed on
Nov 18, 1993
Sold by
E A Collins Development Corp
Bought by
Hoffman Robert E
Home Financials for this Owner
Home Financials are based on the most recent Mortgage that was taken out on this home.
Original Mortgage
$79,700
Interest Rate
7.2%
Create a Home Valuation Report for This Property
The Home Valuation Report is an in-depth analysis detailing your home's value as well as a comparison with similar homes in the area
Home Values in the Area
Average Home Value in this Area
Purchase History
| Date | Buyer | Sale Price | Title Company |
|---|---|---|---|
| Binh Ngoc Nguyen Lv22 Trust | -- | -- | |
| Nguyen Binh Ngoc | $222,500 | Roc Title | |
| Bakelis Vicky | $74,500 | Fidelity National Title | |
| Schlembach Christopher | $74,800 | Nevada Title Las Vegas | |
| Hoffman Robert E | -- | Nevada Title Las Vegas | |
| Hoffman Robert E | $84,000 | National Title Company |
Source: Public Records
Mortgage History
| Date | Status | Borrower | Loan Amount |
|---|---|---|---|
| Previous Owner | Hoffman Robert E | $79,700 |
Source: Public Records
Tax History Compared to Growth
Tax History
| Year | Tax Paid | Tax Assessment Tax Assessment Total Assessment is a certain percentage of the fair market value that is determined by local assessors to be the total taxable value of land and additions on the property. | Land | Improvement |
|---|---|---|---|---|
| 2025 | $1,177 | $64,182 | $26,950 | $37,232 |
| 2024 | $1,090 | $64,182 | $26,950 | $37,232 |
| 2023 | $1,090 | $59,939 | $25,550 | $34,389 |
| 2022 | $1,010 | $53,382 | $20,650 | $32,732 |
| 2021 | $980 | $46,048 | $19,250 | $26,798 |
| 2020 | $949 | $46,926 | $18,900 | $28,026 |
| 2019 | $921 | $44,012 | $16,100 | $27,912 |
| 2018 | $879 | $39,671 | $12,950 | $26,721 |
| 2017 | $1,126 | $38,037 | $11,550 | $26,487 |
| 2016 | $824 | $35,950 | $9,450 | $26,500 |
| 2015 | $821 | $32,694 | $6,650 | $26,044 |
| 2014 | $796 | $25,961 | $6,300 | $19,661 |
Source: Public Records
Map
Nearby Homes
- 7985 Trea Ave
- 7885 W Flamingo Rd Unit 1113
- 7885 W Flamingo Rd Unit 1115
- 7885 W Flamingo Rd Unit 1016
- 7885 W Flamingo Rd Unit 1050
- 7885 W Flamingo Rd Unit 2153
- 7885 W Flamingo Rd Unit 2005
- 7885 W Flamingo Rd Unit 1127
- 7885 W Flamingo Rd Unit 1131
- 7885 W Flamingo Rd Unit 2129
- 7885 W Flamingo Rd Unit 1161
- 7885 W Flamingo Rd Unit 2003
- 7885 W Flamingo Rd Unit 2120
- 7950 W Flamingo Rd Unit 1085
- 7950 W Flamingo Rd Unit 1041
- 7950 W Flamingo Rd Unit 1069
- 7950 W Flamingo Rd Unit 1039
- 7950 W Flamingo Rd Unit 1169
- 7950 W Flamingo Rd Unit 1077
- 7950 W Flamingo Rd Unit 1168
- 7984 W Nevso Dr
- 7984 W Nevso Dr
- 7984 W Nevso Dr
- 7977 Lonette Ave Unit 1
- 7971 Lonette Ave
- 7983 Lonette Ave
- 7966 W Nevso Dr
- 7990 W Nevso Dr
- 7965 Lonette Ave
- 7965 Lonette Ave Unit n/a
- 7989 Lonette Ave Unit 1
- 7960 W Nevso Dr Unit na
- 7960 W Nevso Dr
- 7976 Lonette Ave
- 7970 Lonette Ave
- 7970 Lonette Ave Unit 1
- 7982 Lonette Ave
- 7954 W Nevso Dr
- 7964 Lonette Ave
- 7988 Lonette Ave