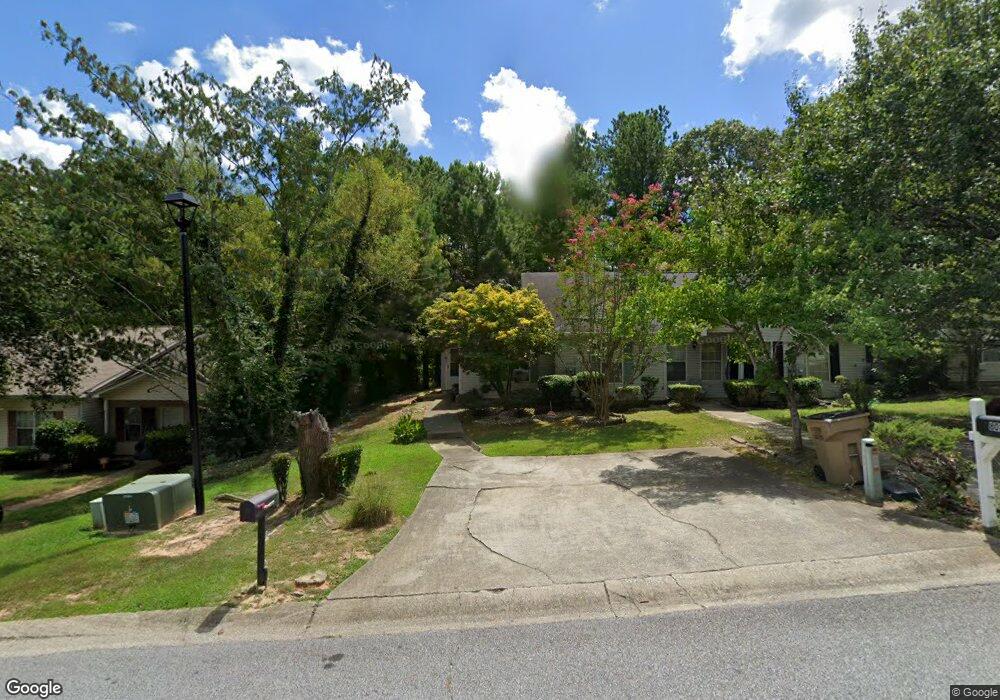
798 Boston Common Unit II Atlanta, GA 30349
Estimated Value: $146,169 - $160,000
2
Beds
2
Baths
1,130
Sq Ft
$135/Sq Ft
Est. Value
About This Home
This home is located at 798 Boston Common Unit II, Atlanta, GA 30349 and is currently estimated at $152,792, approximately $135 per square foot. 798 Boston Common Unit II is a home located in Clayton County with nearby schools including Martin Luther King- Jr. Elementary School, Sequoyah Middle School, and North Clayton High School.
Ownership History
Date
Name
Owned For
Owner Type
Purchase Details
Closed on
May 28, 2021
Sold by
Kempson Robert L
Bought by
Cameron Linda E
Current Estimated Value
Home Financials for this Owner
Home Financials are based on the most recent Mortgage that was taken out on this home.
Original Mortgage
$77,600
Outstanding Balance
$70,104
Interest Rate
2.9%
Mortgage Type
New Conventional
Estimated Equity
$82,688
Purchase Details
Closed on
Jul 29, 2002
Sold by
Kempson Robert L
Bought by
Turnnage Crystal L
Purchase Details
Closed on
Jun 11, 1999
Sold by
Fidelity National Bank
Bought by
Kempson Robert L
Home Financials for this Owner
Home Financials are based on the most recent Mortgage that was taken out on this home.
Original Mortgage
$59,650
Interest Rate
7.13%
Mortgage Type
FHA
Purchase Details
Closed on
Oct 16, 1995
Sold by
Hollis Dallis Y
Bought by
Fidelity National Mtg Corp
Create a Home Valuation Report for This Property
The Home Valuation Report is an in-depth analysis detailing your home's value as well as a comparison with similar homes in the area
Home Values in the Area
Average Home Value in this Area
Purchase History
| Date | Buyer | Sale Price | Title Company |
|---|---|---|---|
| Cameron Linda E | $80,000 | -- | |
| Turnnage Crystal L | -- | -- | |
| Kempson Robert L | $60,500 | -- | |
| Fidelity National Mtg Corp | $61,431 | -- | |
| Hollis Dallis | $56,900 | -- |
Source: Public Records
Mortgage History
| Date | Status | Borrower | Loan Amount |
|---|---|---|---|
| Open | Cameron Linda E | $77,600 | |
| Previous Owner | Kempson Robert L | $59,650 | |
| Closed | Hollis Dallis | $0 |
Source: Public Records
Tax History Compared to Growth
Tax History
| Year | Tax Paid | Tax Assessment Tax Assessment Total Assessment is a certain percentage of the fair market value that is determined by local assessors to be the total taxable value of land and additions on the property. | Land | Improvement |
|---|---|---|---|---|
| 2024 | $960 | $57,480 | $6,400 | $51,080 |
| 2023 | $2,098 | $58,120 | $6,400 | $51,720 |
| 2022 | $461 | $32,000 | $6,120 | $25,880 |
| 2021 | $1,221 | $29,960 | $6,400 | $23,560 |
| 2020 | $1,134 | $27,413 | $6,400 | $21,013 |
| 2019 | $1,143 | $27,208 | $5,600 | $21,608 |
| 2018 | $900 | $21,242 | $5,600 | $15,642 |
| 2017 | $906 | $21,328 | $5,600 | $15,728 |
| 2016 | $913 | $21,506 | $5,600 | $15,906 |
| 2015 | $898 | $0 | $0 | $0 |
| 2014 | $847 | $20,328 | $5,600 | $14,728 |
Source: Public Records
Map
Nearby Homes
- 807 Boston Common
- 834 Pine Shoals Ct
- 758 Boston Common Unit II
- 939 Silverwood Dr
- 5582 Windwood Rd
- 5591 Windwood Rd Unit 2
- 5517 Rock Shoals Way
- 5721 Hidden Brook Cir
- 5549 Pine Gate Dr
- 5488 Windwood Rd
- 1103 Hidden Brook Trail
- 425 Eagles Flight Ln
- 416 Eagles Flight Ln
- 1114 Summer Brook Rd
- 5428 Glen Haven Dr
- 1145 Brookstone Rd
- 5426 Glen Haven Dr
- 5446 Waterfall Ct
- 792 Boston Common
- 806 Boston Common
- 802 Boston Common Unit 2
- 802 Boston Common
- 802 Boston Common Unit 802
- 788 Boston Common Unit II
- 810 Boston Common
- 810 Boston Common Unit 810
- 784 Boston Common
- 780 Boston Common
- 776 Boston Common Unit 11
- 0 Boston Common Unit 7303136
- 0 Boston Common Unit 7210462
- 0 Boston Common Unit 7071789
- 0 Boston Common Unit 7068152
- 0 Boston Common Unit 7044524
- 0 Boston Common Unit 8420073
- 0 Boston Common Unit 7098326
- 0 Boston Common Unit 8201634
- 0 Boston Common Unit 8129364