Estimated Value: $292,000 - $333,000
--
Bed
1
Bath
1,846
Sq Ft
$168/Sq Ft
Est. Value
About This Home
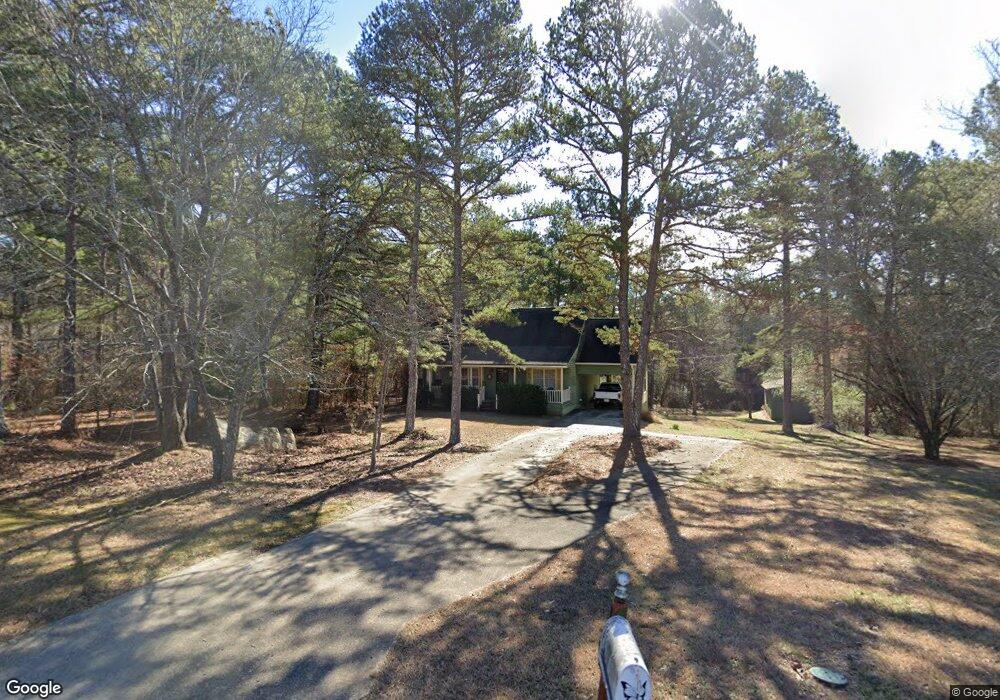
This home is located at 798 Moran Lake Rd NE, Rome, GA 30161 and is currently estimated at $309,363, approximately $167 per square foot. 798 Moran Lake Rd NE is a home located in Floyd County with nearby schools including Model Middle School, Model High School, and Unity Christian School.
Ownership History
Date
Name
Owned For
Owner Type
Purchase Details
Closed on
Dec 1, 2006
Sold by
Not Provided
Bought by
Lovvorn John R
Current Estimated Value
Home Financials for this Owner
Home Financials are based on the most recent Mortgage that was taken out on this home.
Original Mortgage
$100,000
Interest Rate
6.29%
Mortgage Type
New Conventional
Purchase Details
Closed on
Jul 5, 2006
Sold by
Not Provided
Bought by
Lovvorn John R
Purchase Details
Closed on
Dec 17, 1999
Sold by
Sullins Hilamer and Sullins Cirrece
Bought by
Anderson Vicki
Purchase Details
Closed on
May 20, 1978
Sold by
Sullins Bunie
Bought by
Sullins Hilamer and Sullins Cirrece
Purchase Details
Closed on
Jan 1, 1976
Sold by
Sullins William Jessee
Bought by
Sullins Bunie
Purchase Details
Closed on
Jan 11, 1927
Bought by
Sullins William Jessee
Create a Home Valuation Report for This Property
The Home Valuation Report is an in-depth analysis detailing your home's value as well as a comparison with similar homes in the area
Home Values in the Area
Average Home Value in this Area
Purchase History
| Date | Buyer | Sale Price | Title Company |
|---|---|---|---|
| Lovvorn John R | $141,000 | -- | |
| Lovvorn John R | $115,185 | -- | |
| Anderson Vicki | $115,000 | -- | |
| Sullins Hilamer | $3,500 | -- | |
| Sullins Bunie | -- | -- | |
| Sullins William Jessee | -- | -- |
Source: Public Records
Mortgage History
| Date | Status | Borrower | Loan Amount |
|---|---|---|---|
| Closed | Lovvorn John R | $100,000 |
Source: Public Records
Tax History Compared to Growth
Tax History
| Year | Tax Paid | Tax Assessment Tax Assessment Total Assessment is a certain percentage of the fair market value that is determined by local assessors to be the total taxable value of land and additions on the property. | Land | Improvement |
|---|---|---|---|---|
| 2024 | $2,029 | $122,409 | $15,180 | $107,229 |
| 2023 | $1,888 | $104,528 | $13,800 | $90,728 |
| 2022 | $2,157 | $87,096 | $10,948 | $76,148 |
| 2021 | $1,880 | $69,915 | $9,958 | $59,957 |
| 2020 | $1,730 | $60,951 | $8,659 | $52,292 |
| 2019 | $1,674 | $59,053 | $8,659 | $50,394 |
| 2018 | $1,606 | $56,569 | $8,247 | $48,322 |
| 2017 | $1,513 | $53,353 | $7,636 | $45,717 |
| 2016 | $1,515 | $52,815 | $7,600 | $45,215 |
| 2015 | $1,483 | $52,815 | $7,600 | $45,215 |
| 2014 | $1,483 | $52,815 | $7,600 | $45,215 |
Source: Public Records
Map
Nearby Homes
- 424 Wayside Rd NE
- 5 Larkwood Dr NE
- 608 Wayside Rd NE
- 492 Moran Lake Rd NE
- 637 Wayside Rd NE
- 197 Wayside Rd NE
- 84 Harris Rd NE
- 118 Dekle Dr NE
- 0 Scarlett Ln Unit 10548767
- 0 Scarlett Ln Unit 7601914
- 109 Dekle Dr NE
- 108 Dekle Dr NE
- 0 Calhoun Rd NE Unit 7516251
- 0 Calhoun Rd NE Unit 10488821
- 26 Greer Dr NE
- 0 Carrington Place NE Unit 7512224
- 0 Carrington Place NE Unit 10443994
- 16 Barnesdale Way NE
- 16 Maycroft Ct
- 13 Maycroft Ct
- 798 Moran Lake Rd NE
- 803 Moran Lake Rd NE
- 836 Moran Lake Rd NE
- 777 Moran Lake Rd NE
- 773 Moran Lake Rd NE
- 775 Moran Lake Rd NE
- 725 Moran Lake Rd NE
- 871 Moran Lake Rd NE
- 871 Moran Lake Rd NE
- 872 Moran Lake Rd NE
- 823 Moran Lake Rd NE
- 929 Moran Lake Rd NE Unit B
- 929 Moran Lake Rd NE
- 880 Moran Lake Rd NE
- 917 Moran Lake Rd NE
- 900 Moran Lake Rd NE
- 929 Moran Lake Rd NE
- 906 Moran Lake Rd NE
- 663 Moran Lake Rd NE
- 928 Moran Lake Rd NE