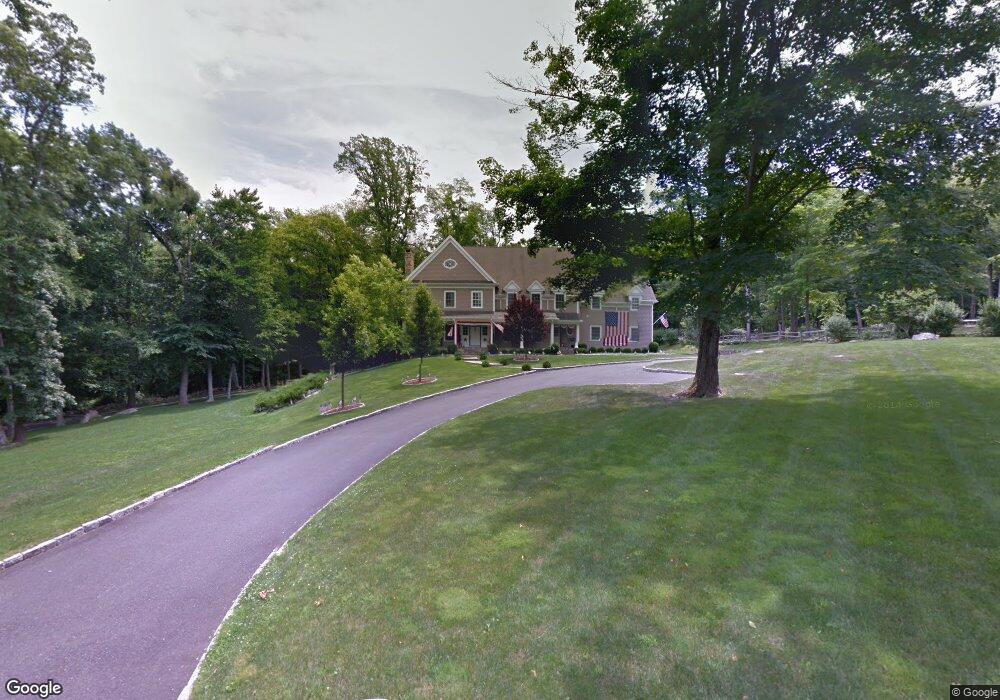
798 N Salem Rd Ridgefield, CT 06877
Estimated Value: $2,227,383 - $2,779,000
5
Beds
6
Baths
6,100
Sq Ft
$409/Sq Ft
Est. Value
About This Home
This home is located at 798 N Salem Rd, Ridgefield, CT 06877 and is currently estimated at $2,494,346, approximately $408 per square foot. 798 N Salem Rd is a home located in Fairfield County with nearby schools including Barlow Mountain Elementary School, Scotts Ridge Middle School, and Ridgefield High School.
Ownership History
Date
Name
Owned For
Owner Type
Purchase Details
Closed on
Mar 25, 2024
Sold by
Eckardt Elizabeth A
Bought by
Scott A Eckardt T A and Scott Eckardt
Current Estimated Value
Purchase Details
Closed on
Oct 28, 2014
Sold by
Eckardt Scott A and Eckardt E M
Bought by
Morello-Eckardt E A
Purchase Details
Closed on
Apr 29, 2009
Sold by
R D Developes Llc
Bought by
Eckardt Scott A
Home Financials for this Owner
Home Financials are based on the most recent Mortgage that was taken out on this home.
Original Mortgage
$700,000
Interest Rate
4.86%
Mortgage Type
Purchase Money Mortgage
Create a Home Valuation Report for This Property
The Home Valuation Report is an in-depth analysis detailing your home's value as well as a comparison with similar homes in the area
Home Values in the Area
Average Home Value in this Area
Purchase History
| Date | Buyer | Sale Price | Title Company |
|---|---|---|---|
| Scott A Eckardt T A | -- | None Available | |
| Scott A Eckardt T A | -- | None Available | |
| Morello-Eckardt E A | -- | -- | |
| Eckardt Scott A | $1,601,000 | -- | |
| Morello-Eckardt E A | -- | -- | |
| Eckardt Scott A | $1,601,000 | -- |
Source: Public Records
Mortgage History
| Date | Status | Borrower | Loan Amount |
|---|---|---|---|
| Previous Owner | Eckardt Scott A | $575,000 | |
| Previous Owner | Eckardt Scott A | $575,000 | |
| Previous Owner | Eckardt Scott A | $700,000 |
Source: Public Records
Tax History Compared to Growth
Tax History
| Year | Tax Paid | Tax Assessment Tax Assessment Total Assessment is a certain percentage of the fair market value that is determined by local assessors to be the total taxable value of land and additions on the property. | Land | Improvement |
|---|---|---|---|---|
| 2025 | $35,326 | $1,289,750 | $315,280 | $974,470 |
| 2024 | $33,985 | $1,289,750 | $315,280 | $974,470 |
| 2023 | $33,288 | $1,289,750 | $315,280 | $974,470 |
| 2022 | $33,679 | $1,184,640 | $210,170 | $974,470 |
| 2021 | $33,419 | $1,184,640 | $210,170 | $974,470 |
| 2020 | $33,312 | $1,184,640 | $210,170 | $974,470 |
| 2019 | $33,312 | $1,184,640 | $210,170 | $974,470 |
| 2018 | $32,909 | $1,184,640 | $210,170 | $974,470 |
| 2017 | $32,570 | $1,197,000 | $201,640 | $995,360 |
| 2016 | $31,948 | $1,197,000 | $201,640 | $995,360 |
| 2015 | $31,134 | $1,197,000 | $201,640 | $995,360 |
| 2014 | $31,134 | $1,197,000 | $201,640 | $995,360 |
Source: Public Records
Map
Nearby Homes
- 803 N Salem Rd
- 401 Old Sib Rd
- 550 Barrack Hill Rd
- 873 N Salem Rd
- 415 Barrack Hill Rd
- 121 Sleepy Hollow Rd
- 10 Hillcrest Ct
- 86 Round Lake Rd
- 0 Walnut Hill Rd
- 85 Spring Valley Rd
- 463 N Salem Rd
- 478 N Salem Rd
- 88 Green Ln
- 4 Lynch Brook Ln
- 40 Thunder Hill Ln
- 83 Aspen Ledges Rd
- 358 N Salem Rd
- 172 Mimosa Cir
- 261 North St
- 399 Ridgebury Rd